Frame Pacing in a Very Simple Scene

I have recently integrated the Tracy profiler into my engine and it has been a great help to be able to visualize how the CPU and GPU are interacting. Even though what is being rendered is as embarrassingly simple as possible there were some things I had to fix that weren’t behaving as I had intended. Until I saw the data visualized, however, I wasn’t aware that there were problems! I have also been using PIX for Windows, NSight, RenderDoc, and gpuview, but Tracy has really been useful in terms of presenting the information across multiple frames in a way that I can customize to see the relationships that I have wanted to see. I thought that it might be interesting to post about some of the issues with screenshots from the profiler while things are still simple and relatively easy to understand.

Visualizing Multiple Frames

Below is a screenshot of a capture from Tracy:

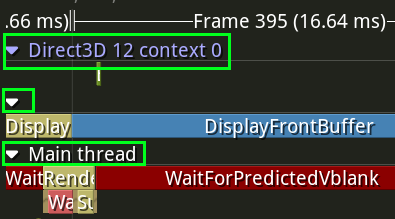
I have zoomed in at a level where 5 full frames are visible, with a little bit extra at the left and right. You can look for Frame 395, Frame 396, Frame 397, Frame 398, and Frame 399 to see where the frames are divided. These frame boundaries are explicitly marked by me, and I am doing so in a thread dedicated to waiting for IDXGIOutput::WaitForVBlank() and marking the frame; this means that a “frame” in the screenshot above indicates a specific frame of the display’s refresh cycle.

There is a second frame visualization at the top of the screen shot where there are many green and yellow rectangles. Each one of those represents the same kind of frames that were discussed in the previous paragraph, and the purple bar shows where in the timeline I am zoomed into (it’s hard to tell because it’s so small but there are 7 bars within the purple section, corresponding to the 1 + 5 + 1 frames visible at the level of zoom).

In addition to marking frames Tracy allows the user to mark what it calls “zones”. This is a way to subdivide each frame into separate hierarchical sections in order to visualize what is happening at different points in time during a frame. There are currently three threads shown in the capture:

  • The main thread (which is all that my program currently has for doing actual work)
  • An unnamed thread which is the vblank heartbeat thread
  • GPU execution, which is not a CPU thread but instead shows how GPU work lines up with CPU work

In order to try and help me make sure that I was understanding things properly I have color coded some zones specifically according to which swap chain texture is relevant. At the moment my swap chain only has two textures (meaning that there is only a single back buffer at any one time and the two textures just get toggled between being the front buffer or back buffer any time a swap happens) and they are shown with DarkKhaki and SteelBlue. In the heartbeat thread the DisplayFrontBuffer zone is colored according to which texture is actually being displayed during that frame (actually this is not true because of the Desktop Windows Manager compositor, but for the purposes of this post we will pretend that it is true conceptually).

I have used the same colors in the main CPU thread to show which swap chain texture GPU commands are being recorded and submitted for. In other words, the DarkKhaki and SteelBlue colors identify a specific swap chain texture, the heartbeat thread shows when that texture is the front buffer, and the main thread shows when that texture is the back buffer. At the current level of zoom it is hard to read anything in the relevant zones but the colors at least give an idea of when the CPU is doing work for a given swap chain texture before it is displayed.

Unfortunately for this post I don’t think that there is a way to dynamically modify the colors of zones in the GPU timeline (instead it seems to be a requirement that are known at compile time) and so I can’t make the same visual correspondence. From a visualization standpoint I think it would be nice to show some kind of zone for the present queue (using Windows terminology), but even without that it can be understood implicitly. I will discuss the GPU timeline more later in the post when things are zoomed in further.

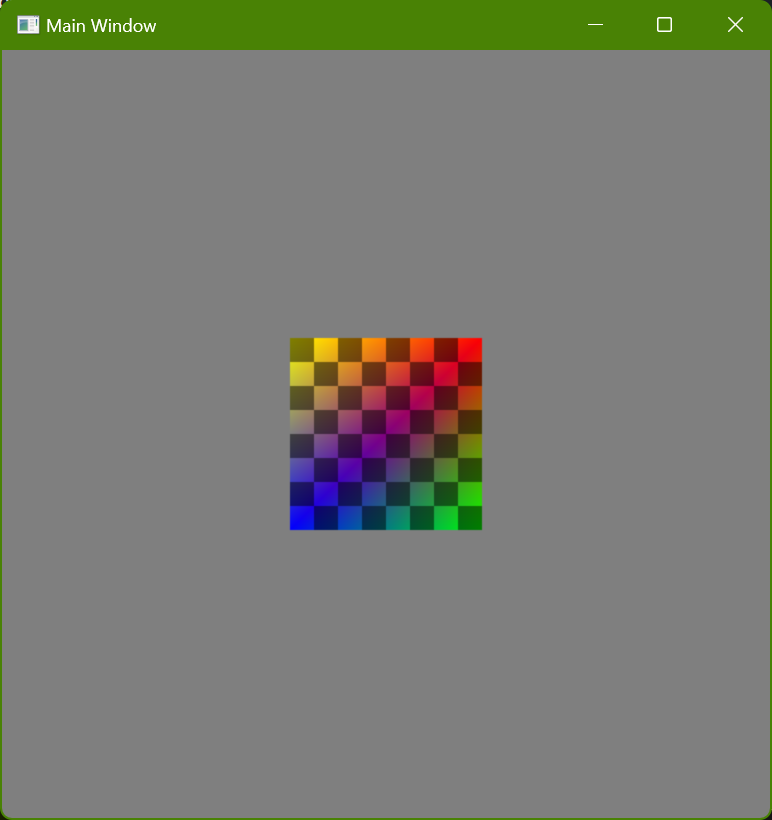
With all of that explanation let me show the initial screenshot again:

Hopefully it makes some kind of sense now what you are looking at!

Visualizing a Single Frame

Let us now zoom in further to just look at a single frame:

During this Frame 326 we can see that the DarkKhaki texture is being displayed as the front buffer. That means that the SteelBlue texture is the back buffer, which is to say that it is the texture that must be modified so that it can then be shown during Frame 327.

Look at the GPU timeline. There is a very small OliveDrab zone that shows work being done on the GPU. That is where the GPU actually modifies the SteelBlue back buffer texture.

Now look at the CPU timeline. There is a zone called RenderGraphicsFrameOnCpu which is where the CPU is recording the commands for the GPU to execute and then submitting those commands (zones are hierarchical, and so the zones below RenderGraphicsFrameOnCpu are showing it subdivided even further). The color is SteelBlue, and so these GPU commands will modify the texture that was being displayed in Frame 395 and that will again be displayed in Frame 397. You may notice that this section starts before the start of Frame 396, while the SteelBlue texture is still the front buffer and thus is still being displayed! In order to better understand what is happening we can zoom in even further:

Compare this with the previous screenshot. This is the CPU work being done at the end of Frame 365 and the beginning of Frame 366, and it is the work that will determine what is displayed during Frame 367.

The work that is done can be thought of as:

  • On the CPU, record some commands for the GPU to execute
  • On the CPU, submit those commands to the GPU so that it can start executing them
  • On the CPU, submit a swap command to change the newly-modified back buffer into the front buffer at the next vblank after all GPU commands are finished executing
  • On the GPU, execute the commands that were submitted

It is important that the GPU doesn’t start executing any commands that would modify the SteelBlue swap chain texture until that texture becomes the back buffer (and is no longer being displayed). The WaitForSwap zone shows where the CPU is waiting for the swap to happen before submitting the commands (which triggers the GPU to start executing the commands). There is no reason, however, that the CPU can’t record commands ahead of time, as long as those commands aren’t submitted to the GPU until the SteelBlue texture is ready to be modified. This is why the RenderGraphicsFrameOnCPU zone can start early: It records commands for the GPU (you can see a small OliveDrab section where this happens) but then must wait before submitting the commands (the next OliveDrab section).

How early can the CPU start recording commands? There are two different answers to this, depending on how the application works. The simple answer (well, “simple” if you understand D3D12 command allocators) is that recording can start as soon as the GPU has finished executing the commands that were previously submitted that were saved in the memory that the new recording is going to reuse. There is a check for this in my code that is so small that it can only be seen if the profiler is zoomed in even further

The reason that this wait is so short is because the GPU work being done is so simple that it reached the submitted swap long before the CPU checked to make sure.

Do you see that long line between executing the GPU commands and then recording new ones on the CPU? With the small amount of GPU work that my program is currently doing (clearing the texture and then drawing two quads) there isn’t anything to wait for by the time I am ready to start recording new commands.

If you’ve been following you might be asking yourself why I don’t start recording GPU commands even sooner. Based on what I’ve explained above the program could be even more efficient and start recording commands as soon as the GPU was finished executing the previous commands, and this would definitely be a valid strategy with the simple program that I have right now:

This is a capture that I made after I modified my program to record new GPU commands as soon as possible. The WaitForPredictedVblank zone is gone, the WaitForGpuToReachSwap zone is now visible at this level of zoom, and the WaitForSwap zone is now bigger. The overlapping of DarkKhaki and SteelBlue is much more pronounced because the CPU is starting to work on rendering a new version of the swap chain texture as soon as that swap chain texture is displayed to the user as a front buffer (although notice that the commands still aren’t submitted to the GPU until after the swap happens and the texture is no longer displayed to the user). Based on my understanding this kind of scheduling probably represents something close to the ideal situation if 1) a program wants to use vsync and 2) knows that it can render everything fast enough within one display refresh and 3) doesn’t have to worry about user input.

The next section explains what the WaitForPredictedVblank is for and why user input makes the idealized screenshot above not as good as it might at first seem.

When to Start Recording GPU Commands

Earlier I said that there were two different answers to the question of how early the CPU can start recording commands for the GPU. In my profile screenshots there is a DarkRed zone called WaitForPredictedVblank that I haven’t explained yet, but we did observe that it could be removed and that doing so allowed even more efficient scheduling of work. This WaitForPredictedVblank zone is related to the second alternate answer of when to start recording commands.

My end goal is to make a game, which means that the application is interactive and can be influenced by the player. If my program weren’t interactive but instead just had to render predetermined frames as efficiently as possible (something like a video player, for example) then it would make sense to start recording commands for the GPU as soon as possible (as shown in the previous section). The requirement to be interactive, however, makes things more complicated.

The results of an interactive program are non-deterministic. In the context of the current discussion this can be thought of as an additional constraint on when commands for the GPU can start being recorded, which is so simple that it is kind of funny to write out: Commands for the GPU to execute can’t start being recorded until it is known what the commands for the GPU to execute should be. The amount of time between recording GPU commands and the results of executing those commands being displayed has a direct relationship to the latency between a user providing input and the user seeing the result of that input on a display. The later that the contents of a rendered frame are determined the less latency the user will experience.

All of that is a long way of explaining what the WaitForPredictedVblank zone is: It is a placeholder in my engine for dealing with game logic and simulation updates. I can predict when the next vblank is (see the Syncing without VSync post for more details), and I am using that as a target for when to start recording the next frame. Since I don’t actually have any work to do yet I am doing a Sleep() in Windows, and since the results of sleeping have limited precision I only sleep until relatively close to the predicted vblank and then wait on the more reliable swap chain waitable object (this is the WaitForSwap zone):

(Side note: Being able to visualize this in the instrumented profile gives more evidence that my method of predicting when the vblank will happen is pretty reliable, which is gratifying.)

The next step will be to implement simulation updates using fixed timesteps and then record GPU commands at the appropriate time, interpolating between the two appropriate simulation updates. That will remove the big WaitForPredictedVblank, and instead there will be some form of individual simulation updates which should be visible.

Conclusion

If you’ve made it this far congratulations! I will show the initial screenshot one more time, showing the current state of my engine’s rendering and how work for the GPU is scheduled, recorded, and submitted:

Syncing without VSync

I don’t remember how many years ago it was when I first read about doing this, but it was probably the following page which introduced me to the idea: https://blurbusters.com/blur-busters-lagless-raster-follower-algorithm-for-emulator-developers/. I am pleased to be able to say that I have finally spent the time to try and implement it myself:

How it Works

An application can synchronize with a display’s refresh cycle (instead of using vsync to do it) if two pieces of data are known:

  • The length of a single refresh (i.e. the refresh rate)
    • This is a duration
  • The time when a refresh ends and the next one starts (i.e. the vblank)
    • This is a repeating timestamp (a moment in time)

If both of these are known then the application can predict when the next refresh will start and update the texture that the graphics card is sending to the display at the appropriate time. If the graphics card changes the texture at the wrong time then “tearing” is visible, which is a horizontal line that separates the old previous texture above it and the new texture below it. (This Wikipedia article as a simulated example image of tearing.)

The texture that is active that the graphics card is sending to the display is called the “front buffer”. The texture that isn’t visible but that the application can generate before it is activated and being sent to the display is called the “back buffer”. There is different terminology for the act of making a back buffer into a front buffer but this post will call it “swapping”, and conceptually it can be thought of as treating the former back buffer as the new front buffer while what was the front buffer becomes a back buffer.

(What vsync does is take care of swapping front and back buffers at the appropriate time. If the application finishes generating a new texture in the back buffer and submits it in time then the operating system and graphics card will work together to make sure that it becomes the new front buffer for the display during the vblank. If the application doesn’t submit it in time and misses the vblank then nothing changes visually: The display keeps showing the old front buffer (meaning that a frame is repeated) and there is no tearing).

Why does swapping the front and back buffers at the wrong time cause tearing? Because even though swapping the front and back buffers happens instantaneously in computer memory the change from one frame to another on a display doesn’t. Instead the display updates gradually, starting at the top and ending at the bottom. Although this isn’t visible to a human eye the effect can be observed using a slow motion camera:

With that in mind it is possible to understand what I am doing in my video: I wrote a program that is manually swapping front and back buffers four times every refresh period in order to intentionally cause tearing. I am not actually rendering anything but instead just doing a very simple clearing of the entire back buffer to some single color, but by swapping a single color back buffer at the correct time in the middle of a display’s refresh I can change the color somewhere in the middle of the display.

Doing this isn’t particularly new and my results aren’t particularly impressive, but I was happy to finally find the time to try it.

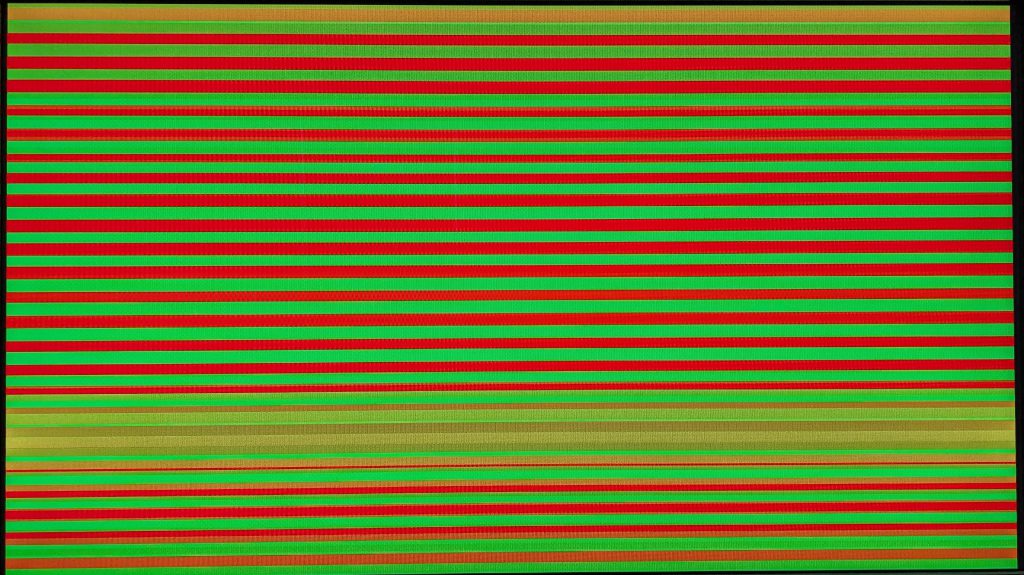
Here is a bonus image where I wasn’t trying to time anything and instead just swapped between alternating red and green as quickly as I was able to:

Implementation Details

The rest of this post contains some additional technical information that I encountered while implementing this. Unlike the preceding section which was aimed at a more general audience the remainder will be for programmers who are interested in specific implementation details.

How to Calculate Time

Calculating the duration of a refresh period isn’t particularly difficult but it’s not sufficient to simply use the reported refresh rate. Although the nominal refresh rate would be close it wouldn’t exactly match the time reported by your CPU clock, and that’s what matters because that’s what you’ll be using to know when to swap buffers. In order to know what the refresh rate is in terms of the CPU clock an average of observed durations must be made. In order to calculate a duration it is necessary to keep track of how much time has elapsed between consistently repeating samples, but it doesn’t actually matter where in the refresh cycle these samples come from as long as they are consistently taken from the same (arbitrary) point in the refresh cycle. So, for example, timing after IDXGISwapChain::Present() returns (with a sync interval of 1 and a full present queue) would work, and timing after IDXGIOutput::WaitForVBlank() returns would also work.

It is more difficult, however, to calculate when the vblank actually happens.

DXGI_FRAME_STATISTICS

I finally settled on using IDXGISwapChain::GetFrameStatistics(). Using this meant that I was relying on DXGI instead of taking my own time measurements, but the big attraction of doing that is that the timestamps were then tied directly to discrete counters. Additionally, as a side benefit, after a bit of empirical testing it seemed like the sampled time in the DXGI frame statistics was always earlier than the time that I could sample myself, and so it seems like it is probably closer to the actual vblank than anything that I knew how to measure.

(The somewhat similar DwmGetCompositionTimingInfo() did not end up being as useful for me as I had initially thought. Alternatively, D3DKMTGetScanLine() seems like it could, in theory, be used for even more accurate results, but it wasn’t tied to discrete frame counters which made it more daunting. If my end goal had been just this particular demo I might have tried using that, but for my actual game engine renderer it seemed like IDXGISwapChain::GetFrameStatistics() would be easier, simpler and more robust.)

The problem that I ran into, however, is that I couldn’t find satisfactory explanations of what the fields of DXGI_FRAME_STATISTICS actually mean. I had to spend a lot of time doing empirical tests to figure it out myself, and I am going to document my findings here. If you found this post using an internet search for any of these DXGI_FRAME_STATISTICS-related terms then I hope this explanation saves you some time. (Alternatively, if you are reading this and find any mistakes in my understanding then please comment with corrections both for me and other readers.)

My Findings

The results of IDXGISwapChain::GetFrameStatistics() are a snapshot in time.

If you call IDXGISwapChain::GetLastPresentCount() immediately after IDXGISwapChain::Present() you will get the correct identifier for the present call that you just barely made, and this is very important to do in order to be able to correctly associate an individual present function call that you made with the information in the DXGI frame statistics (or, at least, it is conceptually important to do; you can also just keep track yourself of how many successful requests to present have been made).

On the other hand, if you call IDXGISwapChain::GetFrameStatistics() immediately after IDXGISwapChain::Present() there is no guarantee that you will get updated statistics (and, in fact, you most likely won’t). Instead, there is some non-deterministic (for you) moment in time after calling IDXGISwapChain::Present() where you would eventually get statistics for that specific request to present in the results of a call to IDXGISwapChain::GetFrameStatistics().

How do you know if the statistics you get are the ones that you want? You know that they are the ones that you want if the PresentCount field matches the value you got from IDXGISwapChain::GetLastPresentCount() after IDXGISwapChain::Present(). Once you call IDXGISwapChain::GetFrameStatistics() and get a PresentCount that matches the one that you’re looking for then you know two things:

  • The statistics that you now have refer to the known state of things when your submitted request to present (made by your call to IDXGISwapChain::Present() ) was actually presented
  • The statistics that you now have will not be updated again for your specific present request. What you now have is the snapshot that was made for your PresentCount , and no more snapshots will be made until another call to IDXGISwapChain::Present() is made (which means that the next time the statistics get updated they will be referring to a different PresentCount from the one that you are currently interested in).

Once you have a DXGI_FRAME_STATISTICS that is a snapshot for your specific PresentCount the important corresponding number is PresentRefreshCount. This tells which refresh of the display your request to present was actually presented during. If vsync is enabled PresentRefreshCount is the refresh of the display when your request to present was actually presented.

Once you have that information you can, incidentally, detect whether your request to present actually happened when you wanted and expected it to. This is described at https://learn.microsoft.com/en-us/windows/win32/direct3ddxgi/dxgi-flip-model#avoiding-detecting-and-recovering-from-glitches, in the “to detect a glitch” section. Although the description of what PresentCount and PresentRefreshCount is confusing to me in that document (and in other official documentation) the description of how to detect a glitch is consistent in my mind with how I have described these fields above, which helps to give me confidence that my understanding is probably correct.

Once you know the information above you can now potentially get timing information. The SyncRefreshCount refers to the same thing as PresentRefreshCount (it is a counter of display refresh cycles), and so it may be confusing why two different fields exist and what the distinction is between the two. PresentRefreshCount is, as described above, a mapping between PresentCount and a display refresh. SyncRefreshCount, on the other hand, is a mapping between the value in SyncQPCTime and a display refresh. The value in SyncQPCTime is a timestamp corresponding to the refresh in SyncRefreshCount. If SyncRefreshCount is the same as PresentRefreshCount then you know (approximately) the time of the vblank when your PresentCount request was actually displayed. It is possible, however, for SyncRefreshCount to be different from PresentRefreshCount, and that is why both fields are in the statistics struct.

To repeat: Information #1 is which display refresh your request was actually displayed in (comparing PresentCount to PresentRefreshCount) and information #2 is what the (approximate) time of a vblank for a specific refresh was (comparing SyncQPCTime to SyncRefreshCount). Derived information #3 is what the (approximate) time of a vblank was for the refresh that your request was actually displayed in.

(Side note: The official documentation here and here is very intentionally vague about when SyncQPCTime is actually measured. The driver documentation here, however, says “CPU time that the vertical retrace started”. I’m not sure if the more accessible user-facing documentation is intentionally vague to not be held accountable for how accurate the timing information is, or if the driver documentation is out-of-date. This post chooses to believe that the time is supposed to refer to the beginning of a refresh, with the caveat that I may be wrong and that even if I’m not wrong the sampled time is clearly not guaranteed to be highly accurate.)

One final thing to mention: A call to IDXGISwapChain::GetFrameStatistics() may return DXGI_ERROR_FRAME_STATISTICS_DISJOINT. One thing to note is that the values in PresentRefreshCount and SyncRefreshCount are monotonically-increasing and, specifically, they don’t reset even when the refresh rate changes. The consequence of this is that the DXGI_ERROR_FRAME_STATISTICS_DISJOINT result is very important for determining timing (like this post is concerned about). If you record the first PresentRefreshCount reported in the first successful call after DXGI_ERROR_FRAME_STATISTICS_DISJOINT was returned then you have a reference point for any future SyncRefreshCounts reported (until the next DXGI_ERROR_FRAME_STATISTICS_DISJOINT). Specifically, you know how many refresh cycles have happened with the current refresh rate.

How to Calculate Refresh Period

Calculating the refresh period using SyncRefreshCount and SyncQPCTime is not difficult: Average the elapsed time between the sampled timestamps of refreshes. I am using the incremental method described here: https://en.wikipedia.org/wiki/Algorithms_for_calculating_variance#Welford’s_online_algorithm. This is easy to calculate and doesn’t require any storage beyond the current mean and the sample count. It can have problems with outliers or if the duration changes, though, and although I don’t anticipate either of those being issues it remains to be seen.

How to Predict VBlanks

I did some thinking about how to do this, and after some internet searching (I am not a numerical methods expert and so it took me a while to even figure out the correct search terms for what I was thinking) I found a really nice post about how to do exactly what I wanted, an incrementally-updating method for calculating the line that is the least-squares best fit for a bunch of sample points: https://blog.demofox.org/2016/12/22/incremental-least-squares-curve-fitting/. I liked this because it was a match for the incremental average function I was using, and since refresh cycles should happen regularly I figured that I could use SyncRefreshCount as the independent variable and SyncQPCTime as the dependent variable and then have a really computationally cheap way of predicting the time for any given refresh (in the past or in the future).

The good news is that this worked really well after some tweaking of my initial naive approach! The bad news is that the changes that I had to make in order to make it work well made me nervous about whether it would continue to perform well over time.

The big problem was losing precision. The SyncRefreshCount are inherently big numbers, but I already had to do some normalizing anyway so that they started at zero (see discussion above about DXGI_ERROR_FRAME_STATISTICS_DISJOINT) and so that didn’t seem so bad. SyncQPCTime, however, are also big numbers. The same trick of starting at zero can be used, and I also represented them as seconds (instead of the Windows high performance counts) and this helped me to get good results. I was worried about the long-term viability of this, however: Unlike the incremental method for the average this method required squaring numbers and multiplying big numbers together, and these numbers would constantly increase over time.

Even though I was quite happy with finding an algorithm that did what I had thought of, once I had implemented it there was still something that bothered me: I was trying to come up with a line equation, where the coefficients are the slope and the y-intercept. I already knew the slope, though, because I had a very good estimate of the duration of a refresh. In other words, I was solving for two unknowns using a bunch of sample points, but I already knew one of those unknowns! What I really wanted was to start with the slope and then come up with an estimate of the y-intercept only, and so it felt like the method I was using should be constrainable even more.

With that in mind I eventually came up with what I think, in hindsight, is a better solution even aside from precision issues. I know the “exact” duration between every vblank (we will conceptually consider that to be known, even though it’s an estimate), and for each reported sample I know the exact number of refreshes since the initial starting point (which is a nice discrete integer value), and then I know the approximate sampled time, which is the noisy repeated sample data I am getting that I want to improve in order to make predictions. What I can do, then, is to calculate what the initial starting time (for refresh count 0) would be, and incrementally calculate an average of that. This gives me the same cheap way of calculating the prediction (just a slope (refresh period) and a y-intercept (this initial timestamp)), but also a cheap way of updating this estimate (using the same incrementally-updating average method that I discussed above). And, even better, I can update it every frame without worrying about numerical problems. (Eventually with enough sample counts there will be issues with the updated value being too small, but that won’t impact the accuracy of the current average if we assume that it is very accurate by then.)

This means that I don’t have to spend time initially waiting for the averages to converge; instead I can just start with single sample that is already a reasonably good estimate and then proceed with normal rendering, knowing that my two running averages will keep getting more accurate over time with every new DXGI frame statistic that I get with new SyncRefresh information.

Application with an Empty Window

Behold, the main window of an application using my nascent engine:

It does as little as one might expect from the screenshot, but some of the architecture might be of interest.

Build System

This section shows parts of the jpmake project file.

Platforms and Configurations

The different possible platforms and configurations are defined as follows:

-- Platforms
------------

-- Define the platforms by name and type

platform_windows = DefinePlatform("windows", "win64")
local platform_windows = platform_windows

-- Get the specified platform to execute tasks for
platform_target = GetTargetPlatform()
local platform_target = platform_target

-- Configurations
-----------------

-- Define the configurations by name

configuration_unoptimized = DefineConfiguration("unoptimized")
local configuration_unoptimized = configuration_unoptimized

configuration_optimized = DefineConfiguration("optimized")
local configuration_optimized = configuration_optimized

configuration_profile = DefineConfiguration("profile")
local configuration_profile = configuration_profile

configuration_release = DefineConfiguration("release")
local configuration_release = configuration_release

-- Get the specified configuration to execute tasks for
local configuration_current = GetCurrentConfiguration()

I am creating global variables for each platform and configuration so that they are accessible by other Lua files and then immediately assigning them to local variables so that they are cheaper to use in this file. (I currently only have the single Lua project file, but soon I will want to change this and have separate files that can focus on different parts of the project.)

At the moment I am specifying any platform-specific information using a strategy like if platform_target == platform_windows and that works fine (there are several examples later in this post), but I am considering defining something like isWindows = platform_target == platform_windows instead. There won’t be many platforms (only one for the foreseeable future!) and it seems like it would be easier to read and write many platform-specific things with a single boolean rather than with a long comparison. I am doing something similar with the configurations where I define booleans that serve as classification descriptions, and so far it feels nice to me (again, there are examples later in this post).

Directory Structure

The directory structure from the perspective of jpmake is currently defined as follows:

-- Source Files
do
	SetEnvironmentVariable("engineDir", "Engine/")
	SetEnvironmentVariable("appsDir", "Apps/")
end
-- Generated Files
do
	-- Anything in the temp directory should be generated by jpmake executing tasks
	-- and the entire folder should be safely deletable.
	-- Additionally, any files that are not part of the Git repository
	-- should be restricted to this folder.
	SetEnvironmentVariable("tempDir", ConcatenateTable{"temp/", platform_target:GetName(), "/", configuration_current, "/"})
	-- The intermediate directory is for files that must be generated while executing tasks
	-- but which aren't required to run the final applications
	SetEnvironmentVariable("intermediateDir", "$(tempDir)intermediate/")
	SetEnvironmentVariable("intermediateDir_engine", "$(intermediateDir)engine/")
	-- The artifact directory is where jpmake saves files
	-- that it uses to execute tasks
	SetArtifactDirectory("$(intermediateDir)jpmake/")
	-- The staging directory contains the final applications that can be run
	-- independently of the source project and intermediate files
	SetEnvironmentVariable("stagingDir", "$(tempDir)staging/")
end

As a general rule I don’t like abbreviations in variable or function names but I decided to keep the “dir” convention from Visual Studio since these environment variable names will be used so frequently in paths that it seems like a reasonable exception to keep things shorter and more readable. (I did, however, decide to change the first letter to lowercase which fits with my variable naming convention better.)

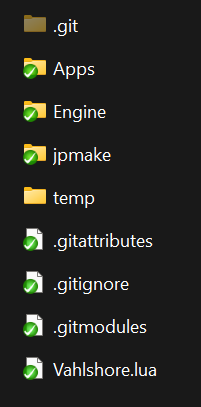
An issue that I have run into in the past is having trouble deciding how to name directory environment variables to distinguish between source and generated files, and with games where there can be code and assets both for the engine and the application the possible choices are even more complex (and, to make matters worse, with this project I am intending to support multiple applications using the engine and so there is yet a further distinction that must be made). What I have will likely change as time goes on and I write more code, but it feels like a good start. The root repository folder looks like this:

Any files that are generated by the build process are kept quarantined in a single folder (temp/) so that the distinction between source and deletable files is very clear. This is very important to me (as anyone who has worked with me can attest). The temp directory looks like the following, expanded for one platform and configuration:

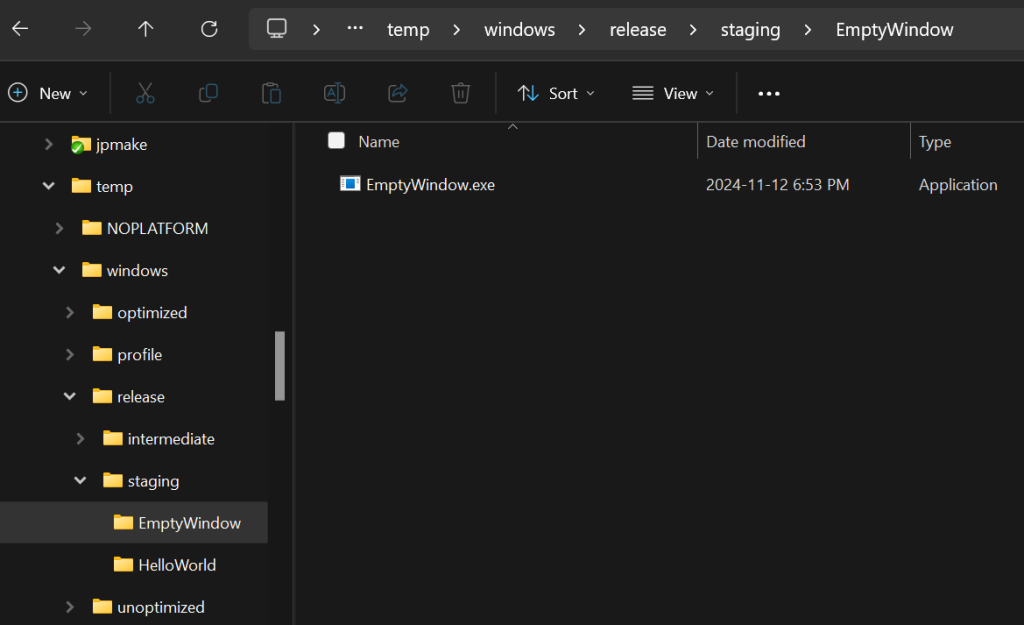
With such a simple application the only thing in the staging directory is the executable file, but when I develop more complicated applications there will be other files in staging directories (e.g. the assets that the game loads).

One further consideration that is currently missing is what to do with “tools”, those programs that are used during development (either for authoring content or as part of the build process) but that don’t get released to end users. I can imagine that I might want to update some of this directory structure when I start developing tools.

C++ Configuration

The next section in the jpmake project file configures the default settings for how C++ is built for the current target platform and build configuration:

-- C++
------

-- Initialize C++ for the current platform and configuration
cppInfo_common = CreateCppInfo()
local cppInfo_common = cppInfo_common
do
	-- #define VLSH_PLATFORM_SOMENAME for conditional compilation
	do
		local platform_define_suffix
		if (platform_target == platform_windows) then
			platform_define_suffix = "WINDOWS"
		else
			platform_define_suffix = "NONE"
		end
		cppInfo_common:AddPreprocessorDefine(("VLSH_PLATFORM_" .. platform_define_suffix),
			-- There isn't any anticipated reason to check anything other than whether the platform is #defined,
			-- but the name is used as a value because why not?
			platform_target:GetName())
	end
	-- The project directory is used as an $include directory
	-- so that directives like the following can be done to show scope:
	--	#include <Engine/SomeFeature/SomeHeader.hpp>	
	cppInfo_common:AddIncludeDirectory(".")
	local isOptimized = configuration_current ~= configuration_unoptimized
	cppInfo_common:AddPreprocessorDefine("VLSH_CONFIGURATION_ISOPTIMIZED", isOptimized)
	local isForProfiling = configuration_current == configuration_profile
	cppInfo_common:AddPreprocessorDefine("VLSH_CONFIGURATION_ISFORPROFILING", isForProfiling)
	local isForRelease = configuration_current == configuration_release
	cppInfo_common:AddPreprocessorDefine("VLSH_CONFIGURATION_ISFORRELEASE", isForRelease)
	do
		local areAssertsEnabled = not isForRelease and not isForProfiling
		cppInfo_common:AddPreprocessorDefine("VLSH_ASSERT_ISENABLED", areAssertsEnabled)
	end
	cppInfo_common.shouldStandardLibrariesBeAvailable = false
	cppInfo_common.shouldPlatformLibrariesBeAvailable = false
	cppInfo_common.shouldExceptionsBeEnabled = false
	cppInfo_common.shouldDebugSymbolsBeAvailable =
		-- Debug symbols would also have to be available for release in order to debug crashes
		not isForRelease
	if platform_target == platform_windows then
		cppInfo_common.VisualStudio.shouldCRunTimeBeDebug = not isOptimized
		cppInfo_common.VisualStudio.shouldIncrementalLinkingBeEnabled =
			-- Incremental linking speeds up incremental builds at the expense of bigger executable size
			not isForRelease
		-- Warnings
		do
			cppInfo_common.VisualStudio.shouldAllCompilerWarningsBeErrors = true
			cppInfo_common.VisualStudio.shouldAllLibrarianWarningsBeErrors = true
			cppInfo_common.VisualStudio.compilerWarningLevel = 4
		end
	end
end

This shows the general approach I am taking towards configuring things (both from the perspective of the game engine and also from the perspective of jpmake and my personal ideal way of configuring software builds). The named configurations (e.g. unoptimized, optimized, profile, release) that I defined earlier are just arbitrary names from the perspective of jpmake and don’t have any semantics associated with them. Instead it is up to the user to specify how each configuration behaves. I can imagine that this would be seen as a negative for most people, but I have a personal issue where I generally prefer to have full control over things.

This section should not be understood as being complete (most notably there actually aren’t any optimization-related settings except for which C run-time to use!) but that is because I haven’t implemented all of the Visual Studio options in jpmake yet.

Engine Static Library

Below is one example of a static library that I have made, which provides base classes for applications (meaning that an actual application can inherit from the provided framework):

do
	local task_application = CreateNamedTask("Application")
	local cppInfo_application = cppInfo_common:CreateCopy()
	do
		if (platform_target == platform_windows) then
			cppInfo_application.shouldPlatformLibrariesBeAvailable = true
		end
	end
	engineLibrary_application = task_application:BuildCpp{
			target = "$(intermediateDir_engine)Application.lib", targetType = "staticLibrary",
			compile = {
				"$(engineDir)Application/iApplication.cpp",
				"$(engineDir)Application/iApplication_windowed.cpp",
				platform_target == platform_windows and "$(engineDir)Application/iApplication_windowed.win64.cpp" or nil,
			},
			link = {
				engineLibrary_assert,
				platform_target == platform_windows and CalculateAbsolutePathOfPlatformCppLibrary("User32.lib", cppInfo_application) or nil,
			},
			info = cppInfo_application,
		}
end
local engineLibrary_application = engineLibrary_application

My current plan is to have the “engine” consist of a collection of static libraries that all get linked into the single application executable.

This named task shows a file specific to Windows that is only compiled for that platform (iApplication_windowed.win64.cpp, where my convention is to try to put as much platform-specific code in separate platform-specific CPP files as possible and then those files have the platform name as a sub-extension), as well as a Windows library that is only needed for linking on that platform (User32.lib) and another static library (engineLibrary_assert, which was defined earlier but that I don’t show in this blog post) that this static library depends on.

As more files get created that are specific to one platform or another I think my style will have to change to make it less annoying to conditionally specify each one.

Applications

Finally, the two proof-of-concept applications that I have created are defined as follows:

-- Hello World
--============

do
	do
		SetEnvironmentVariable("appDir", "$(appsDir)HelloWorld/")
		SetEnvironmentVariable("stagingDir_app", "$(stagingDir)HelloWorld/")
	end
	local cppInfo_helloWorld = cppInfo_common:CreateCopy()
	do
		-- For std::cout
		cppInfo_helloWorld.shouldStandardLibrariesBeAvailable = true
	end
	do
		local helloWorld_task = CreateNamedTask("HelloWorld")
		local application_subTask = helloWorld_task:BuildCpp{
				target = "$(stagingDir_app)HelloWorld.exe", targetType = "consoleApplication",
				compile = {
					"$(appDir)EntryPoint.cpp",
				},
				info = cppInfo_helloWorld,
			}
		helloWorld_task:SetTargetForIde(application_subTask)
	end
end

-- Empty Window
--=============

do
	do
		SetEnvironmentVariable("appDir", "$(appsDir)EmptyWindow/")
		SetEnvironmentVariable("stagingDir_app", "$(stagingDir)EmptyWindow/")
	end
	local cppInfo_emptyWindow = cppInfo_common:CreateCopy()
	do
		cppInfo_emptyWindow:AddIncludeDirectory("$(appDir)")
	end
	do
		local emptyWindow_task = CreateNamedTask("EmptyWindow")
		local application_subTask = emptyWindow_task:BuildCpp{
				target = "$(stagingDir_app)EmptyWindow.exe", targetType = "windowedApplication",
				compile = {
					"$(appDir)EntryPoint.cpp",
				},
				link = {
					engineLibrary_application,
				},
				info = cppInfo_emptyWindow,
			}
		emptyWindow_task:SetTargetForIde(application_subTask)
	end
end

These show the general approach towards making executable applications that I am envisioning, although these both are as simple as possible.

One idiom that I discovered is reusing the same environment variable names but setting them to different values for different applications. This allowed the names to be shorter and thus more readable (before this I had different versions with _helloWorld and _emptyWindow), but I don’t have enough experience to decide if this will work well long term.

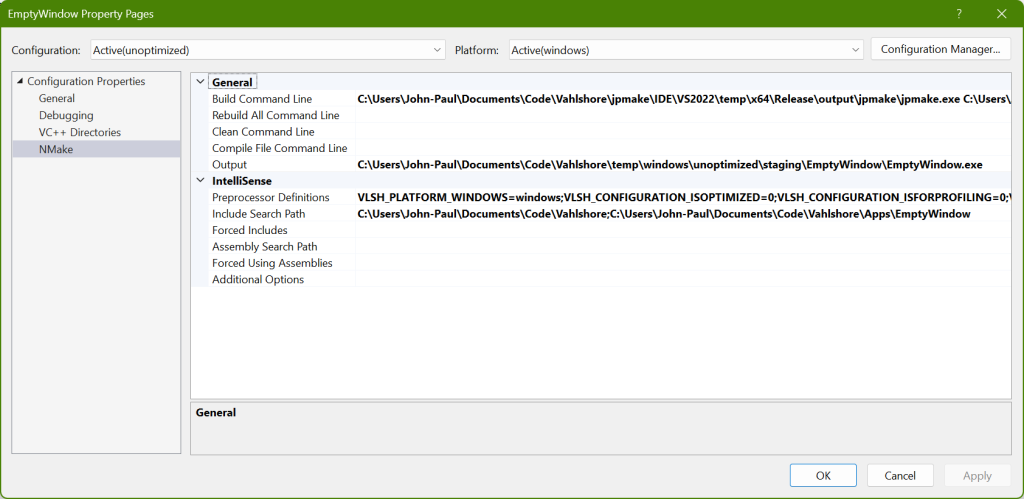
The examples also show calls to SetTargetForIde(), which has no effect when executing tasks but is instead used when generating the solution files so that Visual Studio will correctly have its $(TargetPath) set, which makes setting up debugging easier.

Visual Studio Solution

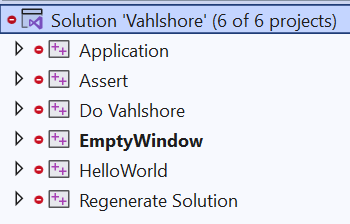
It is now possible for jpmake to generate Visual Studio solution and project files. I did this work to make it easier to write code and debug in Visual Studio. The Solution Explorer currently looks like the following for the jpmake project that I have been showing in this post:

And the properties of the EmptyWindow project have some things filled in:

I had to spend more time on generating these files and additional jpmake features than I had initially anticipated before working on the engine code because I wasn’t able to debug, which felt like a requirement. With the way it works now, however, I was able to write the empty window application and things worked reasonably well.

I did have one discouraging realization, however, which is that Intellisense doesn’t work yet. I was able to complete the empty window application without it but it was more annoying than I would have anticipated. I think I need to take some more time to improve jpmake so that Intellisense will work at least somewhat because not having it has proven to be an annoying impediment.

Custom Build System (Part 1)

This post is part of a series about creating a custom game engine.

In every job I have had I have become involved with the system of how the software is built, and this is also something I spent time making my graduate students work on in their game engine class. Every time, and in all of my personal projects, I have wished that I had my own system that worked the way that I wanted it to, and while I currently have the time to create a custom game engine I have taken the opportunity to try and make such a build system.

The term “build system” may mean different things to different people, but my usage is to refer to the process of taking any source files (code and assets) and transforming them into the final generated files that can be distributed in order to run the software. In some cases the process can be quite simple conceptually (in order to create an executable application using C++, for example, the source files are compiled into object files and then those object files are linked into an executable), but when creating a game the process becomes much more complex: Not only is there traditional code to deal with but there are also assets (input authored data that is not code) as well as interdependencies between code and assets where the content of one can influence how the other is built.

Wishlist

The following is a non-exhaustive list of what I would want in a build system, which contains elements both of the build system tool and of the implementation of how a piece of software uses a build system:

  • The build system is simple to use
    • There should be exactly one step required to go from only the authored files (the ones contained in source control) to the final product that is ready to be distributed
    • (If there is more than one step that should be the fault of the human and not the build system, and the build system should make it possible to automate any extra steps so that there is only one)
  • Builds are deterministic
    • Building the software should always have the same results
      • If an attempt to build has an error and then a subsequent attempt to build succeeds this is a problem
      • If an attempt to build has an error there is never a question of whether it is a real problem or not
  • Nothing is done if a build is requested and nothing needs to be done
  • It is fast to request a build when nothing needs to be done
    • When I am developing the common case should be to request the entire software to be built (it is exceptional when I want to build some parts but explicitly don’t want other parts to change) and it should be fast for a “no-op” build so that it doesn’t interfere with iteration
  • Dependencies are easy to work with
    • It is easy for a human to specify important dependencies
    • As much as possible, however, the system should figure out the dependencies itself without requiring a human to specify them
    • If an attempt to build has an error there is never a question of whether it is because a dependency was missing
    • When an attempt to build something is made there is never a question of whether the result might not be valid because one of its dependencies was not in a correct state (this is restating the deterministic requirement)
  • Assets (i.e. things that aren’t code) are easy to build
  • Generated code is easy to build
  • It is easy to build abstractions and to document and comment
    • When I am creating the system that builds software I want to be able to use good programming practices

When I am developing software with a build system that behaves as I describe above then I have the confidence to iterate and make changes and know that I am seeing the correct results of the changes I made, without worrying about extra steps or that something might be wrong.

Philosophy

I had to come up with some name and I settled on “jpmake”, a silly variation on the common naming scheme of “make”, “nmake”, “cmake”, etc., for build system software. It is based on some of the principles I have thought about for years, although its development is focused on allowing me to work on the custom engine project and so there are features that I know that I would like that I will intentionally not work on until/unless they are needed.

Despite using the term “build” and even though the motivation behind creating this is in order to build software I am designing things with the mental model that there is a “project” which is a collection of tasks that must be done (and these tasks may or may not have dependencies on each other). This means conceptually that a jpmake project could be used the same way e.g. a BAT file in Windows often is, to automate a series of tasks. Although a requirement is to be able to easily specify and build C++ programs the design goal is to have that be just one kind of task that can be done, with the hope that approaching it this way will make it easy to add other as-yet unanticipated kinds of tasks. The user should be able to focus on defining which tasks must be done and what the inputs and outputs of each task are, and then jpmake should be able to figure out the rest.

Lua

I am a big fan of the Lua scripting language and use it when I want to create a text-based interface. I have in fact used it multiple times in the past for smaller build systems, focusing on being able to build assets as part of a larger code-based project, and so I already have some experience with what I am trying to currently accomplish with jpmake.

My favorite thing about Lua is the ability to create interfaces that are easy to understand and use. It has enough flexibility that I can create files that are understandable even by someone who doesn’t know Lua (often understandable enough to make small changes), but it also has the power of a full programming language behind it so that I don’t feel limited when I want to use what I consider good programming practices.

As an example, observe the following lines from a jpmake project file:

local myTask = CreateNamedTask("myTask")
myTask:Copy("someAuthoredFile.txt", "$(OutputDir)someDirectory/someIntermediateFile.txt")

Without knowing any details you could probably guess what line 2 does, and even without knowing the correct syntax you could probably copy line 2, modify it, and get the correct result that you wanted and expected.

One issue I have run into with previous large-scale Lua projects that I’ve done, however, is that although I am completely satisfied with using the finished product in terms of the interface it has been very difficult to remember the details of the inner workings and to debug when things go wrong. For this current project I am taking a different approach to try and mitigate this, where I use Lua script files as the project files that specify what tasks to execute and how, but otherwise everything is implemented in C++. In the case of how I anticipate using jpmake this is probably what I would have done anyway because it means that there is a single executable application that can do everything, but it also has the advantage of easier maintainability because of static typing and making it easy to debug. (Additionally, of course, it can be more efficient. I am trying to manage all of the strings that exist in a program like this (i.e. because there are so many file paths) in an efficient way to keep things fast that wouldn’t be possible if the implementation were in pure Lua.)

Example

Details will have to wait for a part 2, but below is an example from the test project file that I have been using while developing:

-- Set Up
--=======

-- Define the platforms that tasks can be executed for for
local platform_windows = DefinePlatform("Windows", "win64")
-- Get the currently-specified (from the command arguments) platform
local platform_current = GetTargetPlatform()
local platformName_current = platform_current:GetName()
-- Define the configurations that can be used when executing tasks
local configuration_debug = "Debug"
local configuration_optimized = "Optimized"
DefineConfigurations{configuration_debug, configuration_optimized}
-- Get the currently-specified (from the command arguments) configuration
local configuration_current = GetConfiguration()

-- Define environment variables that can be used in paths
SetEnvironmentVariable("TempDir", table.concat{"temp/", platformName_current, "/", configuration_current, "/"})
SetEnvironmentVariable("IntermediateDir", "$(TempDir)intermediate/")
SetEnvironmentVariable("OutputDir", "$(TempDir)output/")

-- Define the C++ info that determines how C++ is built
local cppInfo_common = CreateCppInfo()
do
	-- Libraries can be disabled for situations that only use custom code
	do
		cppInfo_common.shouldStandardLibrariesBeAvailable = false
		cppInfo_common.shouldPlatformLibrariesBeAvailable = false
	end
	cppInfo_common.shouldExceptionsBeEnabled = false
	-- Platform-specific configuration
	if (platform_current == platform_windows) then
		-- A #define can be set for platform-specific conditional compilation
		cppInfo_common:AddPreprocessorDefine("PLATFORM_WINDOWS")
		-- Preprocessor symbols can also have values
		cppInfo_common:AddPreprocessorDefine("PLATFORM_NAME", platformName_current)
		-- Use different VC run-times based on the current configuration
		cppInfo_common.VisualStudio.shouldCRunTimeBeDebug = configuration_current == configuration_debug
	end
end
-- Alternate C++ infos can be created from the base configuration and then have targeted changes
local cppInfo_withStandardLibraries = cppInfo_common:CreateCopy()
do
	cppInfo_withStandardLibraries.shouldStandardLibrariesBeAvailable = true
end
local cppInfo_withPlatformLibraries = cppInfo_common:CreateCopy()
do
	cppInfo_withPlatformLibraries.shouldPlatformLibrariesBeAvailable = true
end

-- C++ Tasks
--==========

do
	-- A "named task" is just for human organization:
	-- It allows only a subset of sub tasks to be executed (rather than the entire project) by specifying a name
	local cppNamedTask = CreateNamedTask("BuildMyCppProgram")
	local staticLibrary_usingPlatformLibraries = cppNamedTask:BuildCpp{
			targetType = "staticLibrary", target = "$(IntermediateDir)usesPlatformLibraries.lib",
			compile = {
				"MyClass.cpp",
			},
			-- Any libraries specified as needing to be linked when defining static library tasks
			-- don't actually influence the creation of the static libraries themselves,
			-- but instead are stored as dependencies
			-- that eventually are linked when an application is created that uses the static libraries
			link = {
				platform_current == platform_windows and CalculateAbsolutePathOfPlatformCppLibrary("Advapi32.lib", cppInfo_withPlatformLibraries) or nil,
			},
			-- This static library looks up a registry value,
			-- and by requesting that platform libraries are available
			-- it allows the #include <windows.h> directive to look in the correct Windows SDK folder
			info = cppInfo_withPlatformLibraries,
		}
	local staticLibrary_usingStandardLibraries = cppNamedTask:BuildCpp{
			targetType = "staticLibrary", target = "$(IntermediateDir)usesStandardLibraries.lib",
			compile = {
				"MySource.cpp",
			},
			-- This static library uses std::cout,
			-- and by requesting that standard libraries are available
			-- it allows the #include <iostream> directive to look in the correct Visual Studio folder
			info = cppInfo_withStandardLibraries,
		}
	local myApplication = cppNamedTask:BuildCpp{
			targetType = "consoleApplication", target = "$(OutputDir)MyApplication.exe",
			--targetType = "windowedApplication", target = "$(OutputDir)MyApplication.exe",
			--targetType = "sharedLibrary", target = "$(OutputDir)MyLibrary.dll",
			compile = {
				"MyEntryPoint.cpp",
			},
			link = {
				staticLibrary_usingPlatformLibraries,
				staticLibrary_usingStandardLibraries,
			},
			info = cppInfo_common,
		}
end

-- Copy Tasks
--===========

do
	-- Here is an example of a differently-named task that does something other than building C++
	local myTask = CreateNamedTask("myTask")
	myTask:Copy("someAuthoredFile.txt", "$(OutputDir)someDirectory/someIntermediateFile.txt")
	myTask:Copy("$(OutputDir)someDirectory/someIntermediateFile.txt", "$(OutputDir)someDirectory/someOtherDirectory/someCopiedFile.txt")	
end

Creating a Video Game and Engine from Scratch

I am attempting to make a video game without using an available engine. I am documenting the process with two different kinds of posts:

  • Discussions of Features
    • These posts are made when I have something of interest to say rather than on a regular schedule
    • They can be found using the Game Engine Features category
  • Status Updates
    • These posts are intended to be made weekly and are not intended to be of interest to a general audience
    • Instead, these posts are a way for me to hold myself accountable by reporting what I have worked on during the previous week and what I intend to work on during the upcoming week
    • They can be found using the devlogs category

Why am I doing this?

I am currently unemployed by choice. I have been very fortunate professionally that I have been able to work on interesting projects, but there are also some things that I have never had a chance to work on that I am personally interested in and would like to explore. Primary among these are:

  • Graphics
    • Hardware ray tracing
      • I fell in love with all things ray tracing while a student at the University of Utah but I have not had an opportunity to develop anything since hardware support was added to consumer GPUs
    • HDR
      • Although I understand the concepts of tonemapping I have never had the opportunity to implement it, and after all of the work I have done with color and light it is an obvious next step and gap in my experience that I would like to fill
  • Memory Management
    • I have a fascination with manual memory management, and I am interested in attempting to write software that always uses explicit allocators rather than the global new/delete so that all memory is budgeted and uses appropriate allocation strategies
    • I am also interested in trying to go all-in on “data-oriented design” to gain more experience about how to design large scale software with cache-friendliness and good access patterns as a priority
  • Engine
    • I would like a better custom basis that I can use to create applications (not just necessarily games)
    • I have almost entirely worked with graphics in my professional career and I would like to gain experience and learn the technical aspects of other areas
  • Game Design
    • I have ideas of things that I like and things that I don’t like from playing games, but my actual experience of user-facing design is limited to APIs and GUI properties

It can be hard to find the energy or motivation to do personal projects like this with a full-time job, and especially with jobs in the industries that I work in which tend to be high-demand (which, to be fair, is also what makes them fun). With this in mind I have quit my job and am taking a temporary break from employment so that I can focus full time on learning and implementing some of the things listed above.

Goals and Scope

The time frame for working on this project is quite limited before I will have to find another paying job. If the end goal were to actually create a finished game that could be released and sold then the only reasonable strategy would be to use an established game engine (like Unreal or Unity), and even then the only kind of game that a solo developer could create in a short amount of time would have to be extremely limited in scope. The majority of my goals for this project, however, involve creating the technology from scratch. This means that the actual goal is primarily to create a game engine, and any “games” that I make will be more like tech demos.

The meaning of what a game engine is in the popular imagination seems to have changed over the years and my impression is that today many people think of a “game engine” as something like Unreal or Unity where there is an editor and it is meant to be used by external users to make any kind of game imaginable. That definition is not what I mean when I talk about what I want to work on, however: I am interested in making something just for me that serves as a framework to create interactive applications. Although in real game development tools are incredibly important I don’t anticipate (sadly) creating any editors for my current project, and any tools will be programs that build game-ready assets from authored assets.

My ideal outcome would be to actually create some finished experience that I could release in some way, but due to the uncertainty around the time available I don’t believe that that should be my criterion for evaluating whether the project succeeds or fails. Instead, my intent is to try and create several small applications along the way that are unfinished and unpolished (i.e. not releasable to a general audience) but that allow me to have some small scale goal to work towards when implementing features. I will also try to document milestones along the way with posts here. The true measure of success for me personally will be if I have been able to implement some of the features listed in the bullet points above.

With that being said, as a way of setting realistically low expectations my goals for an eventual releasable program would be:

  • Graphics rendered using hardware ray tracing
  • Audio sound effects that play dynamically in response to something
  • A player avatar in some kind of third-person view that can be controlled using an Xbox controller
  • Some kind of action/interaction that the player character can do with the environment

My graduate students in a semester-long class used to accomplish something similar (without the ray tracing) using a starting engine that I provided and so the list above feels achievable. I will have to decide as time passes whether to try and focus on implementing the above points early and then improving things or whether to be content focusing on the individual features that are interesting in the moment even if it means not finishing a final project.