Different amounts of exposure can make a photograph brighter or darker. I wanted to emulate camera exposure controls in my rendering software so that exposure of a generated image would behave the same way that it does when using a real camera to take a photograph, and in order to evaluate how well my exposure controls were working I compared real photographs that I had taken with images that I had generated programmatically. This post shows some of those comparisons and discusses issues that I ran into.
There is a lot of initial material in this post to motivate and explain the results but if you want to skip directly to see the comparisons between real photographs and rendered images search for “Rendered Exposure with Indirect Lighting” and you will find the appropriate section.
(There was an original older post that I have now removed; this post that you are currently reading contains updated information, is more accurate, and has more satisfying results.)
Light Sources
There are two different light sources that I used when taking photographs.
Incandescent Bulb
One light that I used was an incandescent bulb:
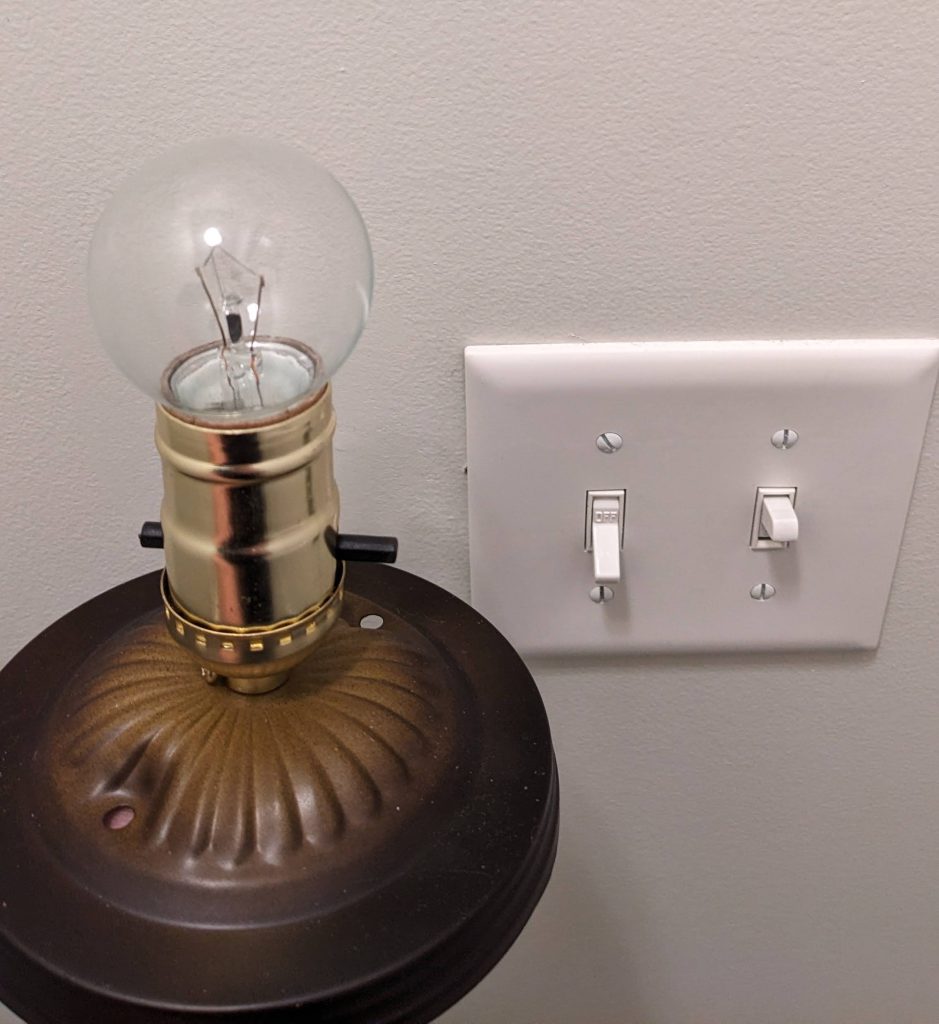
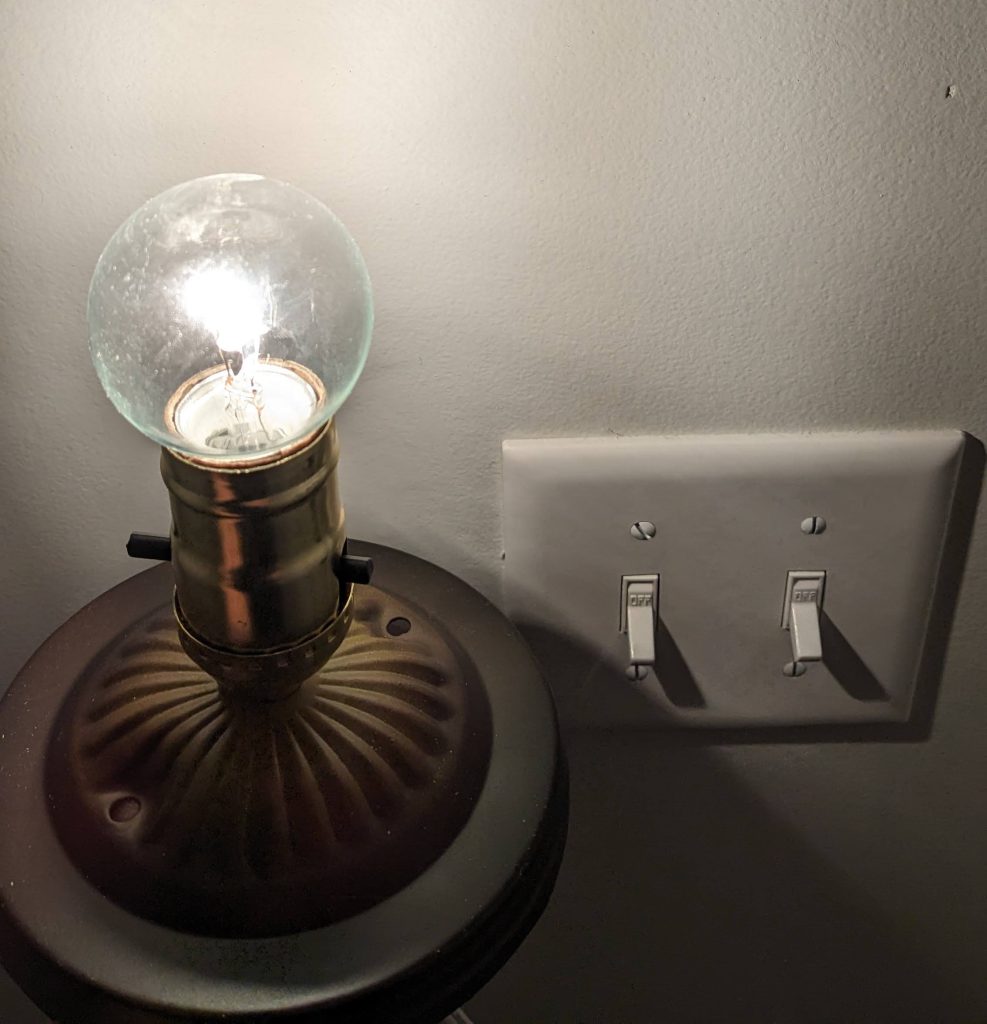
I bought this years ago when they were still available and intentionally chose one with a round bulb that was clear (as opposed to frosted or “soft”) to use for comparisons like in this post so that the emitted light could be approximated analytically by black-body incandescence. It is a 40 W bulb and the box explicitly says that it outputs 190 lumens. The box doesn’t list the temperature although I did find something online for the model that said it was 2700 K. That number is clearly just the standard temperature that is always reported for tungsten incandescent bulbs but for this post we will assume that it is accurate. The following is what a photograph from my phone looks like when the incandescent bulb is turned on in a small room with no other lights on when I allow my phone to automatically choose settings:
LED Bulb
The other light that I used is a new LED bulb that I bought specifically for these current experiments:
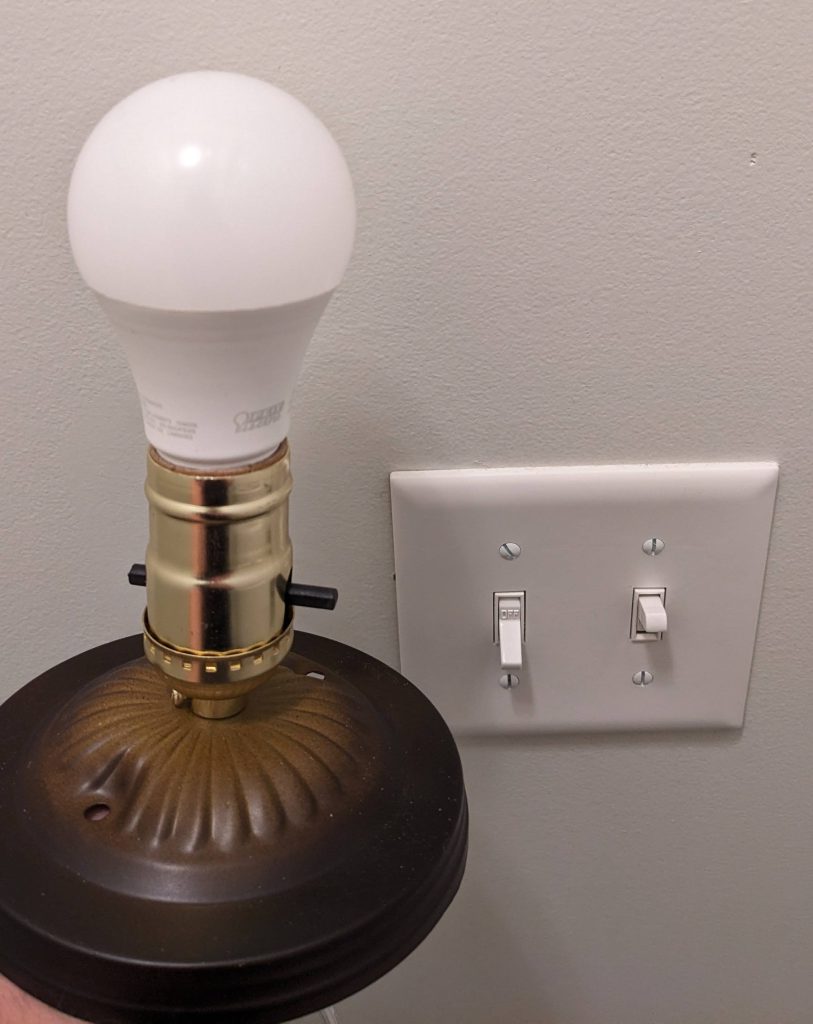
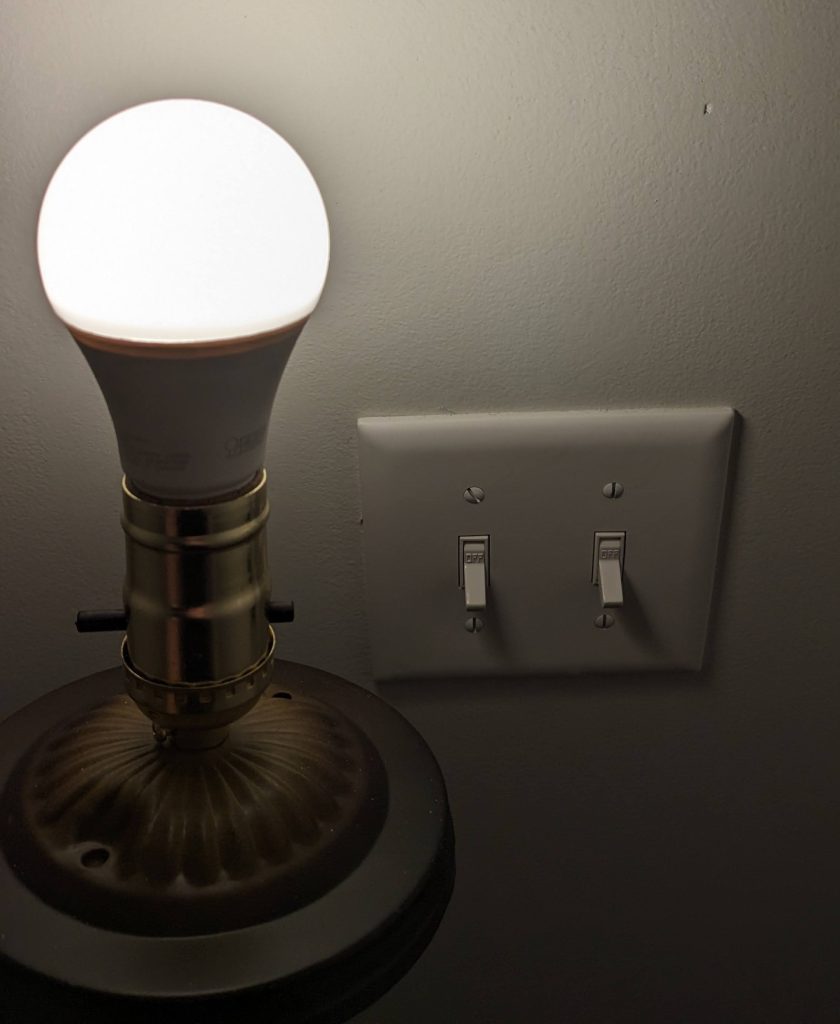
The box says that it outputs 800 lumens, which is slightly more than 4 times the output of the 190 lumen incandescent bulb. This is a “smart” bulb which I chose so that I could change brightness and colors with my phone, but the app unfortunately doesn’t show any quantitative information. There are two modes: White mode (with a slider to control temperature and a few qualitatively-named presets but with no numerical temperature values) and color/saturation mode (which is significantly dimmer than white mode). There is also a brightness slider that shows a percent but doesn’t further quantify what that means. The box shows the range of white temperatures and has 2700 K as the lower limit, and so all of the photographs of the bulb in this post were taken in white mode with the color temperature as low/warm as possible and the brightness as high as possible, which we will assume is 2700 K and 800 lumens. This is what a photograph from my phone looks like when the LED bulb is turned on in the same small test room with no other lights on when I allow my phone to automatically choose settings:
Perceptual Accuracy
Neither of the two photos shown above with the bulbs turned on really capture what my eyes perceived. The color has been automatically adjusted by my phone to use D65 as the white point and so the photos feel more neutral and not particularly “warm” (i.e. there is less of a sense of yellow/orange than what my brain interpreted from my eyes). Later in this post when I show the controlled test photos they will have the opposite problem and look much (much) more orange than what my eyes perceived. Even though the photos above don’t quite match what my eyes perceived they are significantly closer than the orange images that will be shown later and should give you a reasonably good idea of what the room setup looked like for the experiment.
It isn’t just the color that isn’t accurately represented, however. The photos also don’t really convey the relative brightness of the two different bulbs. The LED bulb emits about ~4x more luminous energy than the incandescent bulb in the same amount of time but this isn’t really obvious in the photos that my phone took. Instead the amount of light from each bulb looks pretty similar because my phone camera has done automatic exposure adjustments. Later in this post when I show the controlled test photos it will be more clear that the two bulbs emit different amounts of light.
These initial photos are useful for providing some context for the later test photos. They show the actual light bulbs which are not visible in any of the later photos, and you can also form an idea of what the test room looks like, including the light switches and their plate which is in all of the test photos and rendered images.
Exposure Value (“EV”)
The property that I want to let a user select in my software in order to control the exposure is something called EV, which is short for “exposure value”. The first tests that I wanted to do with my DLSR camera were to:
- Make sure that I correctly understood how EVs behave
- Make sure that my camera’s behavior matched the theory behind EVs
The term “EV” has several different but related meanings. When one is familiar with the concepts there isn’t really any danger of ambiguity but it can be confusing otherwise (it certainly is for me as only a casual photographer). In this post I am specifically talking about the more traditional/original use of EV, which is a standardized system to figure out how to change different camera settings in order to achieve a desired camera exposure. This is the main Wikipedia page for Exposure Value but this section of the article on “EV as an indicator of camera settings” is the specific meaning of the term that I refer to in this post.
There are different combinations of camera aperture and shutter speed settings that can be selected that result in the same exposure. If we arbitrarily choose EV 7 as an example of a desired exposure we can see the following values (from the second Wikipedia link in the previous paragraph) that can be chosen on a camera to achieve an exposure of EV 7 (consult the full table on Wikipedia for more values):
| f-number | 2.8 | 4.0 | 5.6 | 8.0 | 11 | 16 |
| shutter speed | 1/15 | 1/8 | 1/4 | 1/2 | 1 | 2 |
For example, if I wanted the final exposure of a photograph to be EV 7 and I wanted my aperture to have an f-number of 4 then I would set my shutter speed to be 1/8 of a second. If, on the other hand, I wanted my shutter speed to be 1 second but still wanted the final exposure of the photograph to be EV 7 then I would set my aperture to 11.
One way to think about this is that the aperture and shutter speeds are real physical characteristics of the camera but EV is a derived conceptual value that helps photographers figure out how they would have to adjust one of the real physical characteristics to compensate for adjusting one of the other real physical characteristics. (There is also a third camera setting, ISO speed, which factors into exposure but that this particular Wikipedia table doesn’t show. Conceptually, a full EV table would have three dimensions for aperture, shutter speed, and ISO speed.)
When I personally am casually taking photos I intuitively think of “exposure” as a way to make the image brighter or darker (using exposure compensation on my camera), and in this post I sometimes informally talk the same way. A more technically correct way to think about exposure, however, is to recognize that it is related to time: The shutter speed determines how long the sensor is recording light, and the longer that the sensor is recording light the brighter the final image will be. If all other settings remain equal then doubling the amount of time that the shutter is open doubles the amount of light that is recorded (because the camera’s sensor records light for double the amount of time) and that results in the the final photo being brighter. If, on the other hand, the desire is to double the amount of time that the shutter is open but still record the same amount of light (i.e. to not make the final photo brighter even though the new shutter speed causes the sensor to record light for double the amount of time) then something else must be changed to compensate (specifically, either the aperture can be made smaller so that half the amount of light reaches the sensor in the same amount of time or the ISO speed can change so that the sensor records half the amount of light that reaches it in the same amount of time).
For photography there is much more that could be said about this topic but for the purpose of me trying to implement exposure control for graphics rendering this simple explanation is a good enough conceptual basis. The summary that you should understand to continue reading is: “Exposure” determines how bright or dark a photograph is (based on how much time the light from a scene is recorded by a camera sensor and how sensitive to light that sensor is while recording), and EV (short for “exposure value”) is a convenient and intuitive way to classify different exposures. EV is convenient and intuitive because it is a single number that abstracts away the technical details like shutter speed, aperture size, and ISO film speed.
EV 7
Let me repeat the table of EV 7 values shown above:
| f-number | 2.8 | 4.0 | 5.6 | 8.0 | 11 | 16 |
| shutter speed | 1/15 | 1/8 | 1/4 | 1/2 | 1 | 2 |
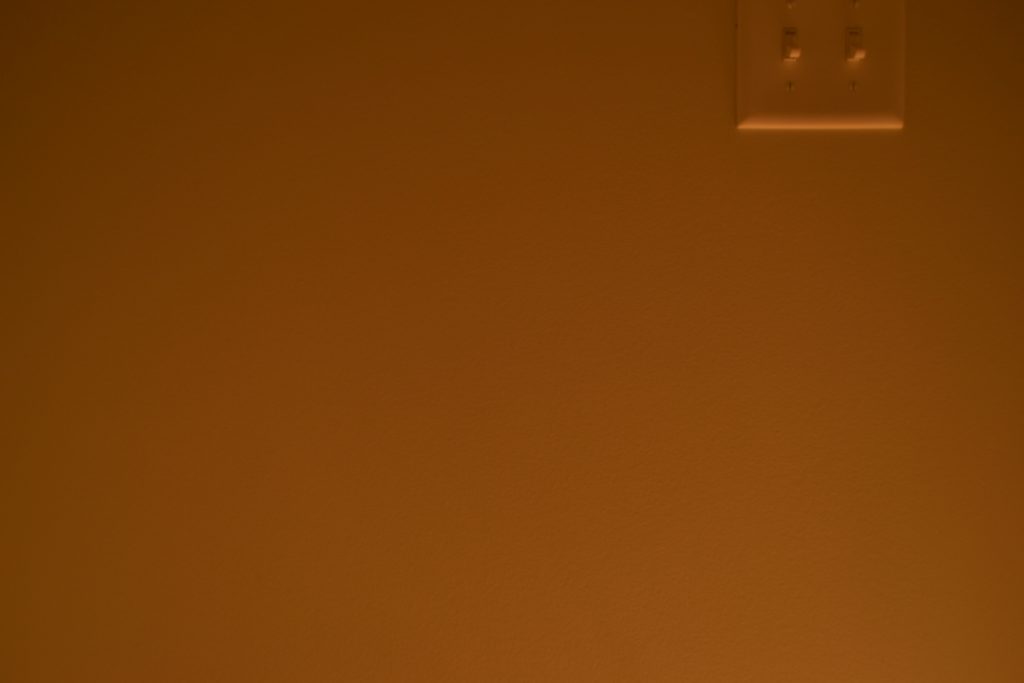
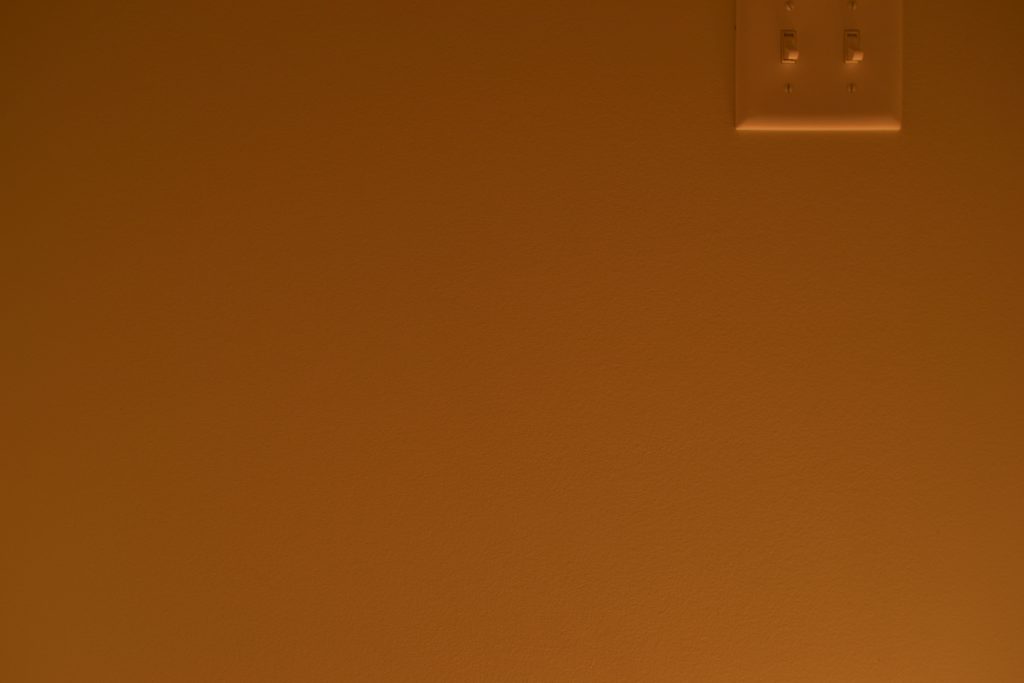
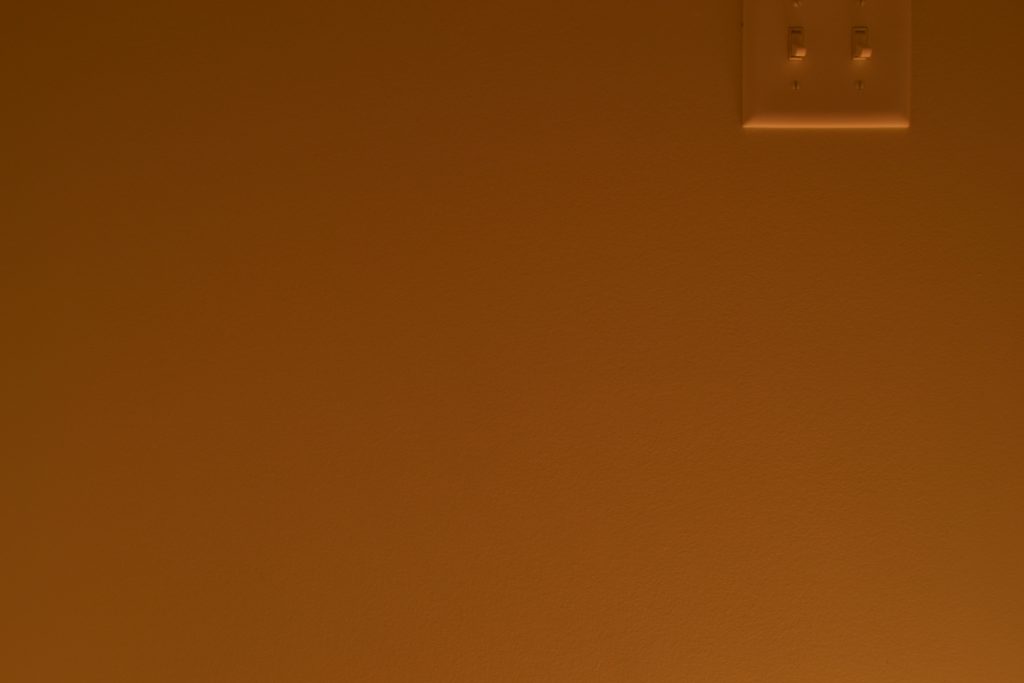
The first thing that I needed to verify was if I took photographs with the settings shown in that chart whether they would all appear to be the same brightness (i.e. would they have the same exposure). The photographs below were taken with the incandescent 190 lumen light bulb and with the camera set to ISO speed 100, using the values shown in that table.
f/4.0, 1/8 second:
f/5.6, 1/4 second:
f/8.0, 1/2 second:
f/11, 1 second:
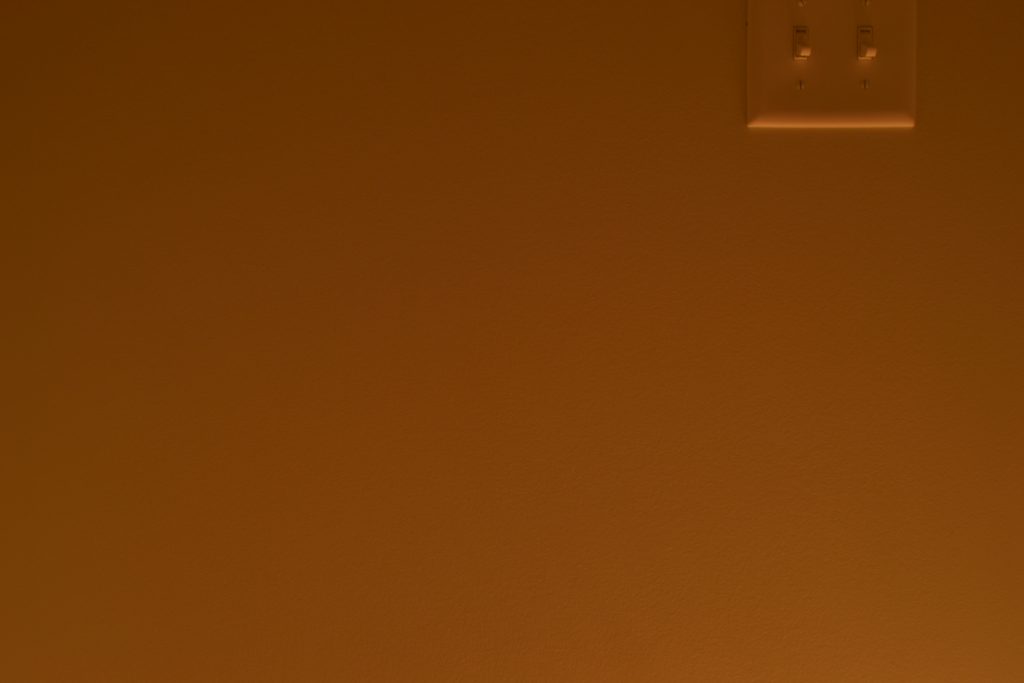
It probably isn’t very exciting looking at these photos because they all look the same but it was exciting when I was taking them and seeing that practice agreed with theory! (If you can’t see any differences you could open the images in separate tabs and switch between them to see that yes, they are different photographs with slight changes.)
If this post were focused on photography I could have come up with a better demonstration to show the effects of different aperture size or shutter speed, but what I cared about was exposure and I needed the photographs to be in this very controlled and simple room so that I would be able to try and recreate the room in software in order to generate images programmatically for comparison.
Why Orange?
Something that you might have noticed immediately is how orange the exposure test photographs are. This is the same room (the same wall and the same light switches) that we saw earlier, with the same light bulb as the only light source in the room:

But it looks very different in the exposure test photographs:

The photos are taken with different cameras (the exposure test photos were taken with a DSLR camera instead of a phone camera), but this isn’t why the color looks so different (the DSLR camera would have produced non-orange photos if I had used its default settings). The reason that the color is so orange in the exposure tests is because I was explicitly trying to set the white point of the camera to be sRGB white (i.e. D65). My specific camera doesn’t let me explicitly choose sRGB as a white point by name, unfortunately, and so instead I calibrated the camera’s white point to a white sRGB display so that it should at least be close (depending on how accurately calibrated my sRGB display was and how accurate the camera’s white point calibration is).
As I mentioned earlier the orange color in the controlled test photos should not be understood to represent what my eyes perceived (it doesn’t!) but is instead a consequence of me attempting to accurately recreate what the camera saw. In the images that I am going to generate programmatically I am not going to do any white balancing and so I wanted to try and convince my camera to do the same thing, and this meant having the camera show the color that its sensor recorded in the context of D65 being white.
If you don’t understand what I am talking about in this section don’t worry; it is not necessary to understand these concepts in order to understand this post and I am intentionally not explaining any details. The important thing to understand is: The orangeish hue in the photos isn’t really what it looked like to my eyes but should theoretically match the images that I am going to generate.
Photographs of Different EVs
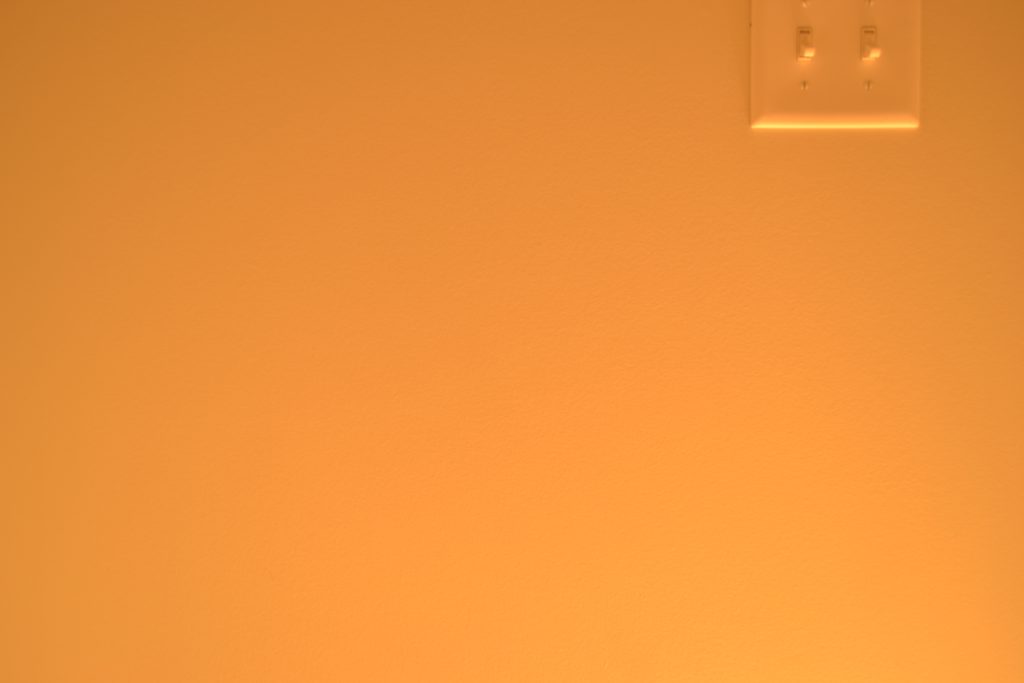
The next step was to take photographs with different exposure values so that I had references to compare with any images that I would programmatically generate. The light bulb in all of the photographs is on the floor, below and slightly to the right of the camera. The room is a very small space (there is a toilet and nothing else; specifically, there are no windows and no irregular corners or other features besides the door and trim) and the paint is fairly neutral (you can see in the photos from my phone camera that the wall paint is a different shade of white from the light switches but it is still unquestionably “white”). The floor is grey tile with lots of variation in the shades of grey; this is not ideal for the current experiment but at least there are no non-neutral hues. All of the test photos shown in the rest of this post use f/4.0 and ISO 100 (meaning that when the EV changes it indicates that I only changed the shutter speed and that the other settings stayed the same).
Incandescent 190 Lumens
EV100 4:
EV100 5:
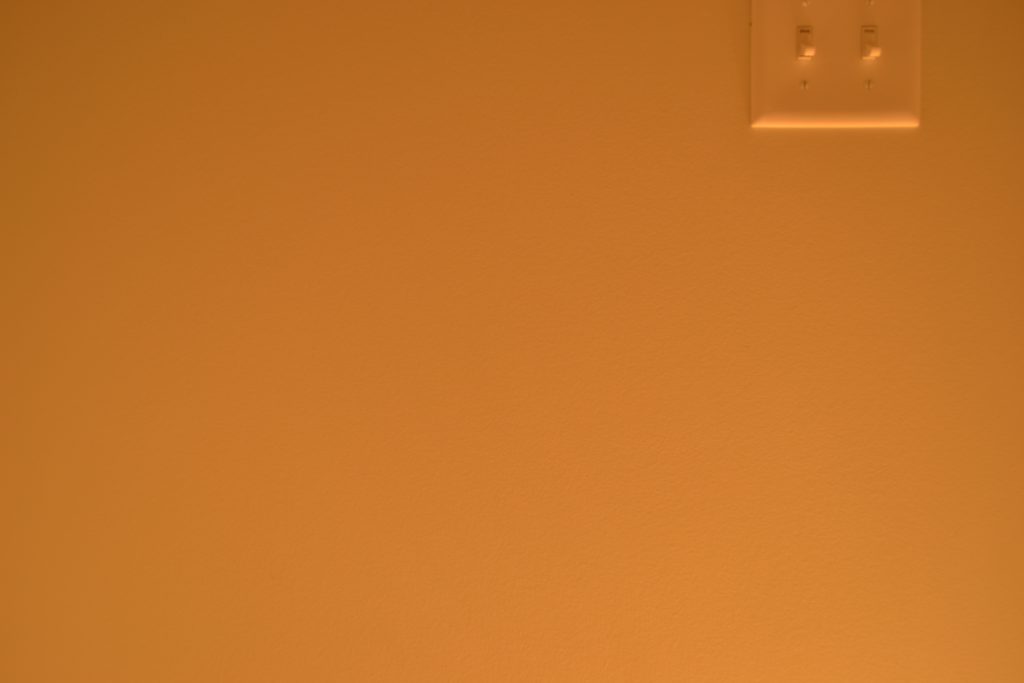
EV100 6:
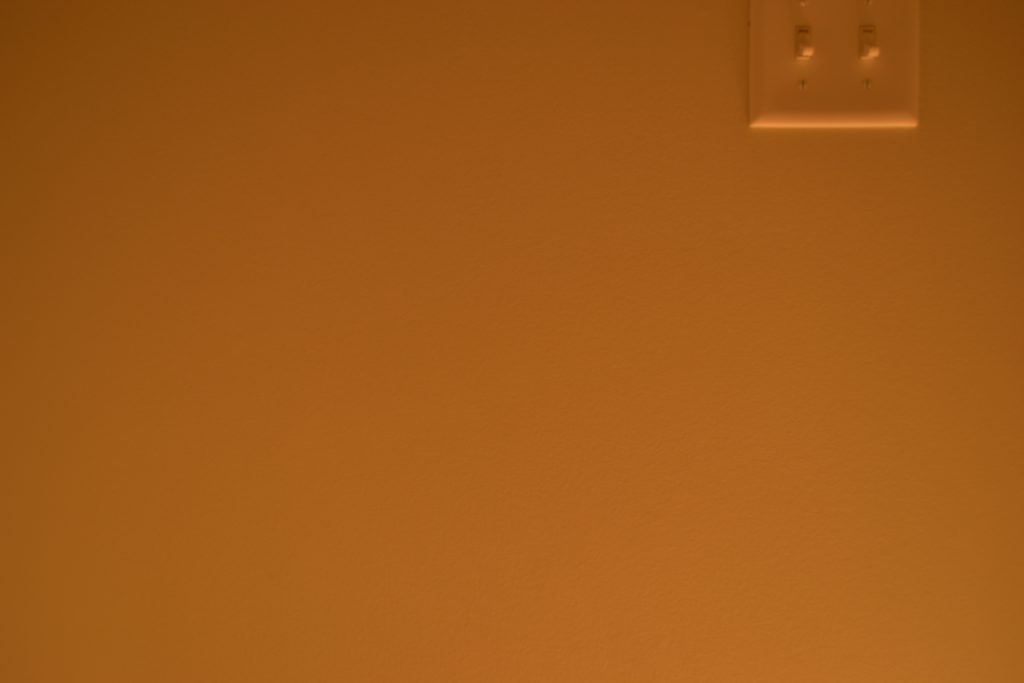
EV100 7:

The photos show the difference in apparent brightness when moving from one EV to another. This difference is called a “stop” in photography. The definitions of EV and stops use a base-2 logarithm which means that a change of one stop (i.e. a change from EV to another) corresponds to either a doubling of exposure or a halving of exposure. If you look at the photographs above with different EV levels it might not look like there is twice the amount or half the amount of recorded light when comparing neighboring EVs but this is because our human eyes don’t perceive these kinds of differences linearly. This is counterintuitive and can be confusing if you aren’t used to the idea and my short sentence is definitely not enough explanation; if you don’t understand this paragraph the important thing to understand for this post is that a mathematical doubling or halving of light (or brightness, lightness, luminance, and similar terms) doesn’t appear twice as bright or half as bright to human eyes.
The difference in apparent brightness between different EVs was pretty interesting to me. I didn’t have a strong preconceived idea ahead of time of what the difference of a stop would look like. The exposure compensation controls on my camera change in steps of 1/3 of an EV (i.e. I have to adjust three times to compensate by a full stop) but as a very casual photographer when I am shooting something I just kind of experiment with exposure compensation to get the result that I want rather than having a clear prediction of how much an adjustment will change things visually (also, since the quality of smart phone cameras has gotten so good I only rarely use my DSLR camera now and so maybe I’ve forgotten what I used to have a better intuitive feel for years ago). I knew that the difference wouldn’t be perceptually linear but before doing these experiments I would have predicted that a change of 2x the amount of luminance would have been more perceptually different than what we see in the photos above. Even though my prediction would have been wrong, however, I am quite pleased with the actual results that we do see. It is easy to see why EVs/stops are a good standard because they feel like very intuitive perceptual differences.
The reason that I wanted to experiment with using EV for exposure was because it was an existing photographic standard (and it seemed like everyone was using it) but seeing these results is encouraging because it suggests that EV is not just a standard but is probably a good standard. Being able to specify and change exposure in terms of EVs or stops seems intuitive and worth emulating in software.
LED 800 Lumens
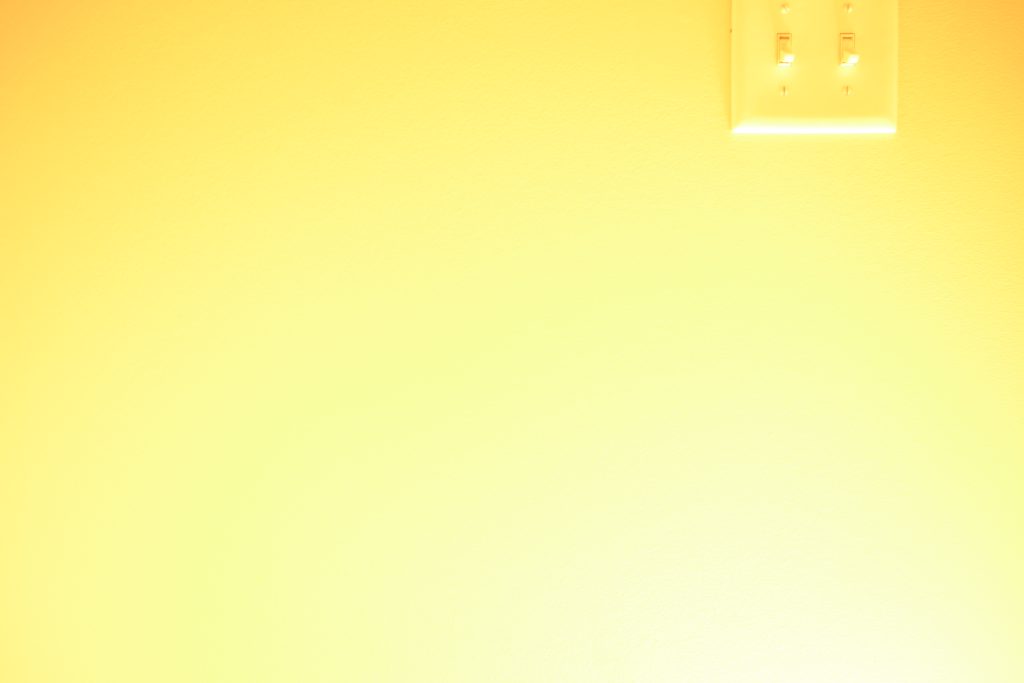
This section shows photographs of the brighter bulb taken with different EV settings.
EV100 4:
EV100 5:
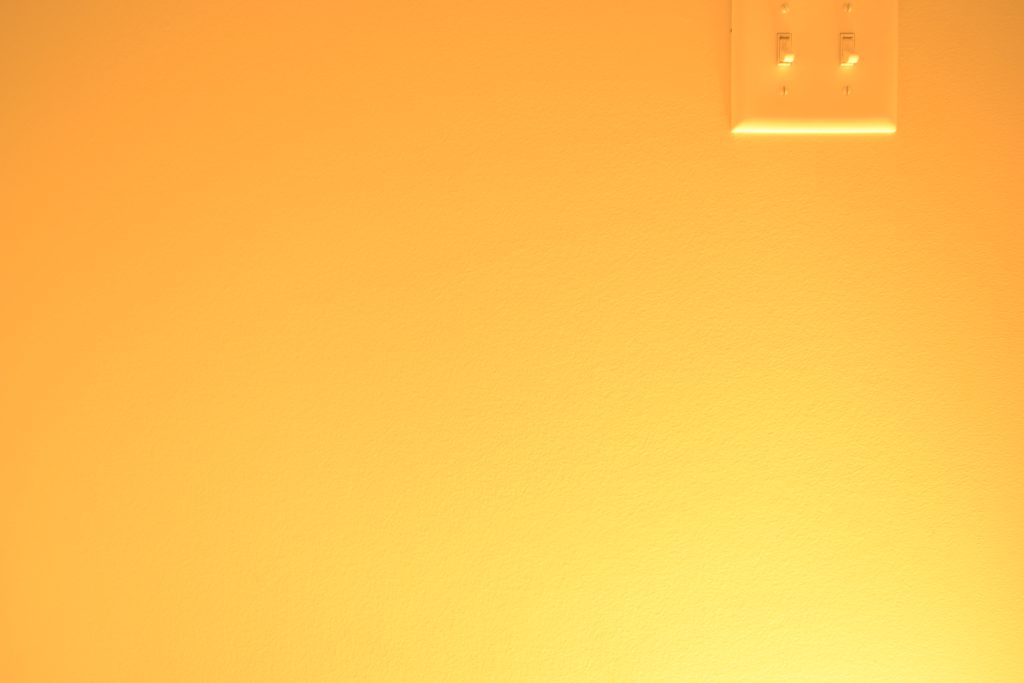
EV100 6:
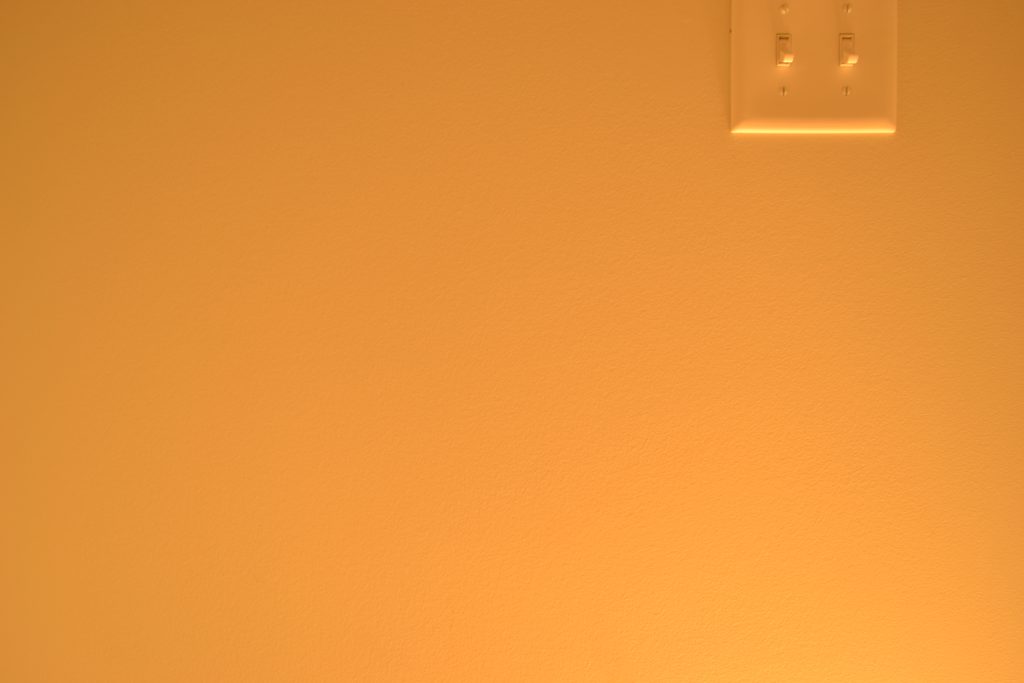
EV100 7:
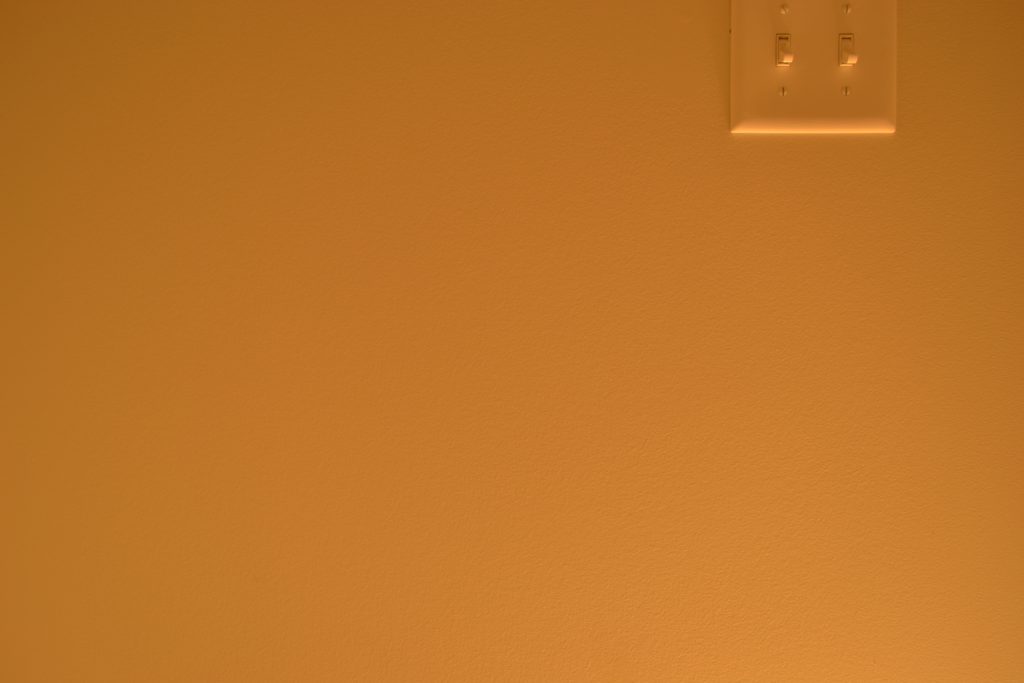
EV100 8:
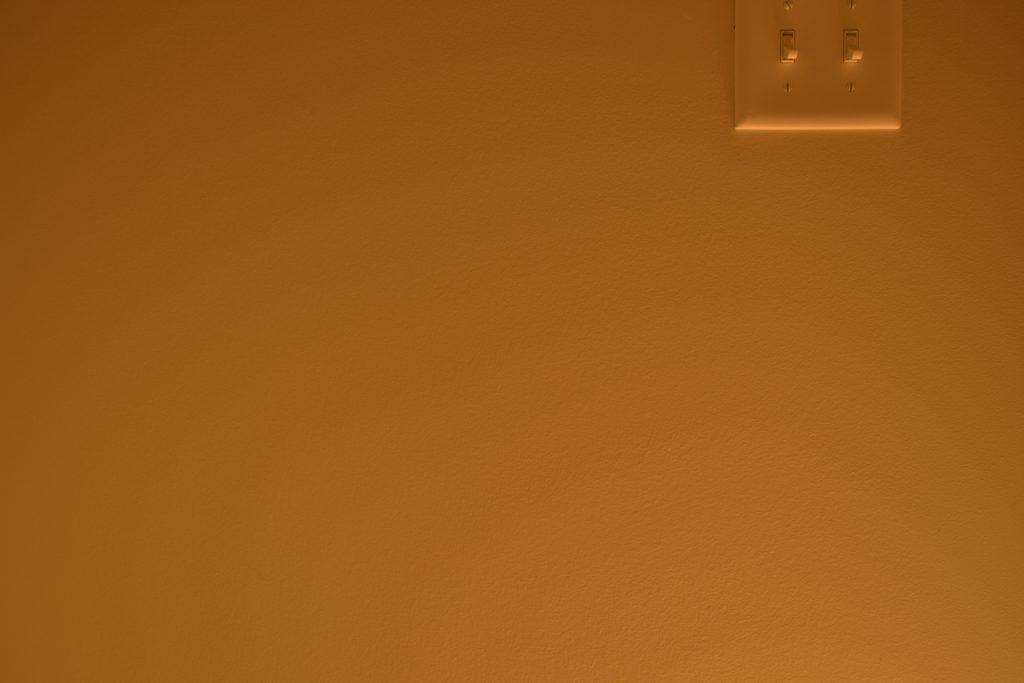
EV100 9:
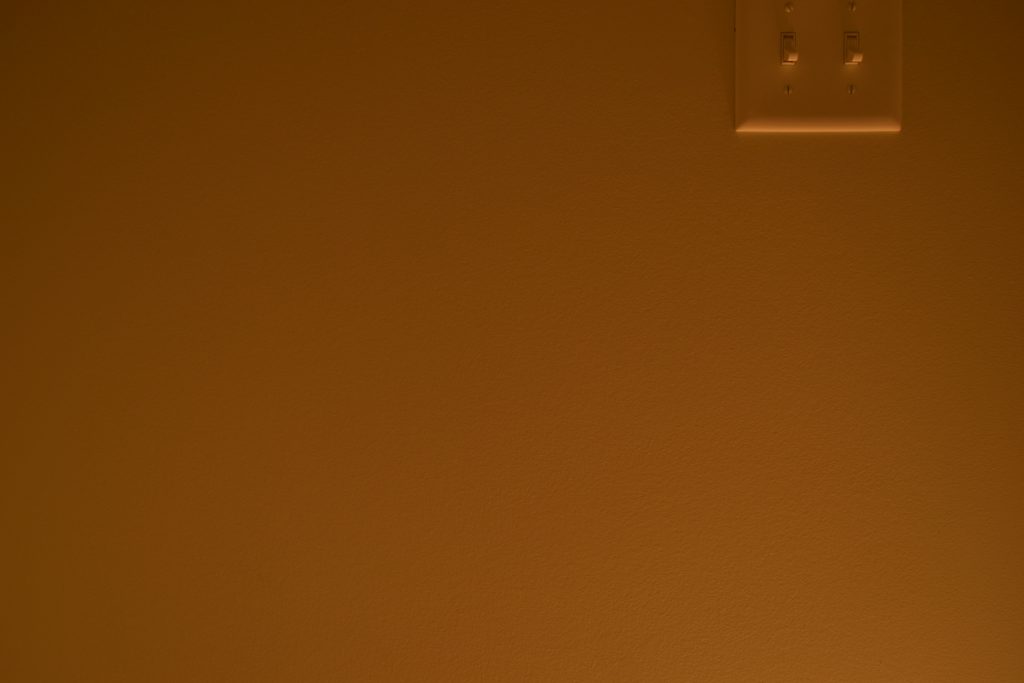
EV100 10:
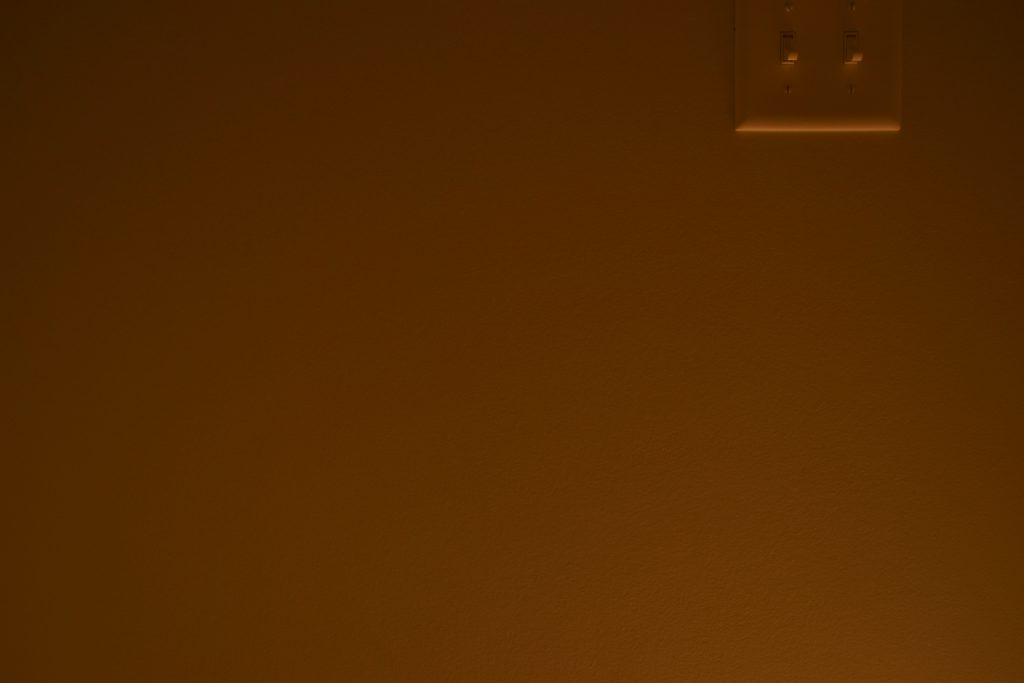
EV100 11:
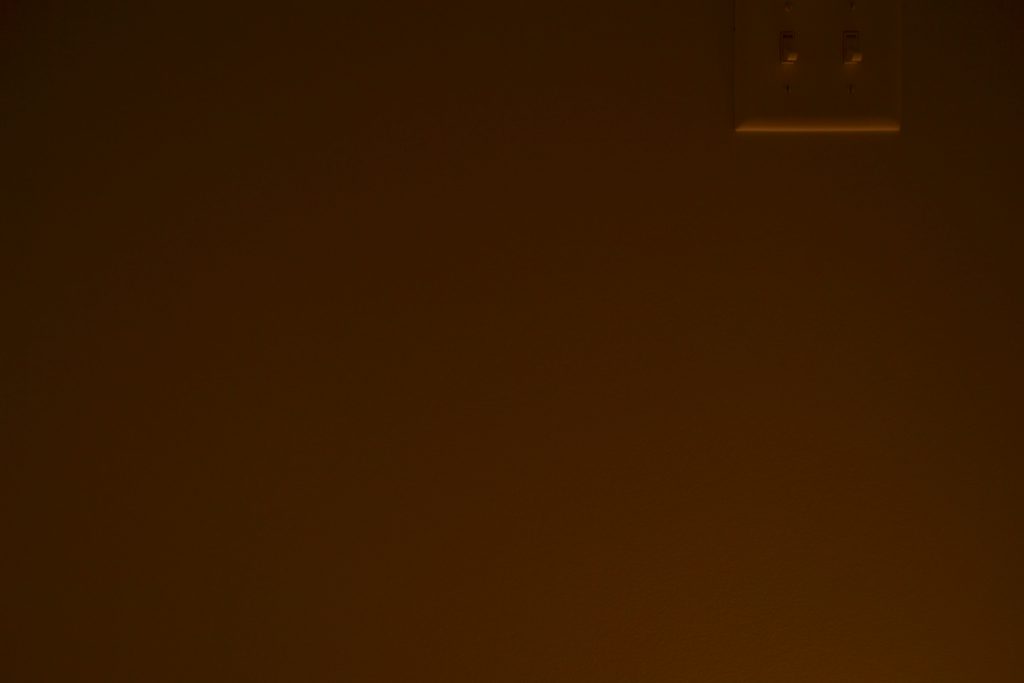
EV100 12:
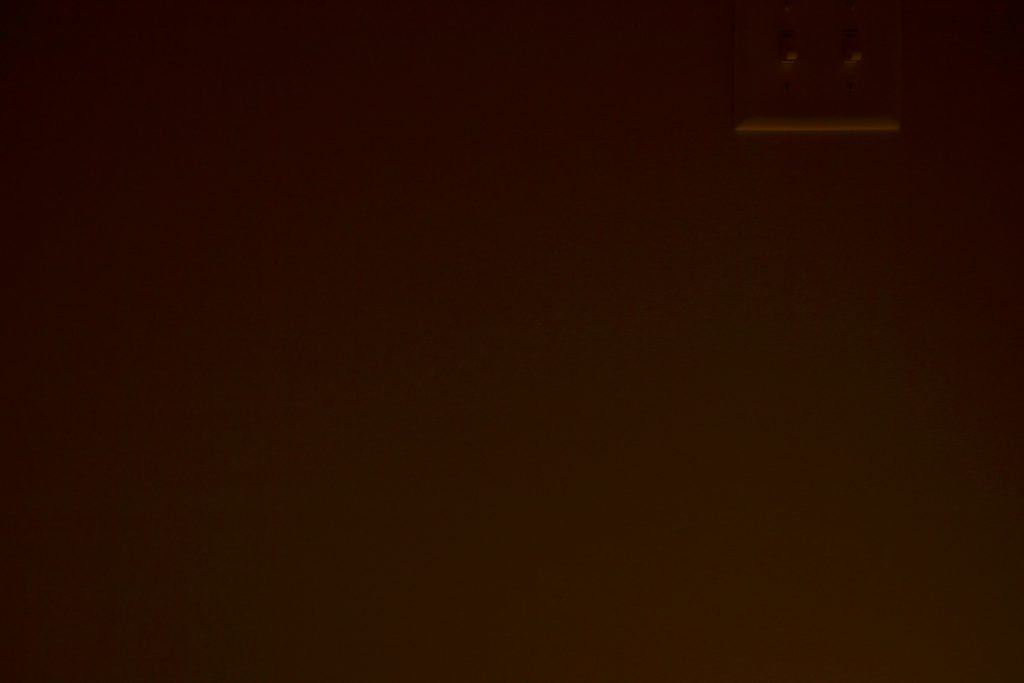
Starting with the same EV as I did with the dimmer 190 lumen bulb (EV100 4) clearly leads to the image being very overexposed with the brighter 800 lumen bulb. Comparing different bulbs with different outputs with the same EV doesn’t make much sense, but there is an easy sanity check that can be done to convert EVs: The 800 lumen bulb emits ~4 times more luminous energy than the 190 lumen bulb in the same amount of time (190 is almost 200 and \(200 * 4 = 800\)) and if every increment of EV (every additional stop) results in a doubling of recorded luminance then we can predict that a difference of 2 EVs would result in about the same appearance between the two different bulbs (2 * 2 = 4). The following photographs compare EV 4 with 190 lumens and EV 6 with 800 lumens (because 6 – 4 = 2):


And sure enough the two photos with different light bulbs look pretty close to each other! Again, I know that images that look the same are inherently not exciting but I think it is actually very cool that two different photographs with different light bulbs and different camera settings look the same, and especially that they look the same not because I changed settings empirically trying to make them look the same but instead only based on following what the math would predict. (This ability to easily and reliably predict exposure was why the EV system was invented and was especially useful before digital cameras when the actual photographs wouldn’t be seen until long after they had been taken.)
Let’s try one more comparison with the dimmest photos of the incandescent bulb that I took. The following compares EV100 7 with 190 lumens and EV100 9 with 800 lumens (because 9 – 7 = 2):


Cool, these two photographs also look very similar!
Rendering Graphics
With the experimental foundation in place the next step was to generate the same scene programmatically and then see if setting different exposure values set via code had the same effect on the rendered images that it had on the photographs.
When I originally made this post I was rendering everything in real time (i.e. at interactive rates) using GPU hardware ray tracing because that is my ultimate goal. It turned out, however, that I was taking too many shortcuts and didn’t have a completely reliable mathematical foundation. I had implemented Monte Carlo path tracing when I was a student but not since and it turned out that there were a lot of details that I didn’t quite remember about getting the probabilities correct (or maybe I just wasn’t as fastidious back then when I wasn’t trying to compare my renderings to actual photographs); to be fair to myself I think my generated images would have been basically correct if I had chosen a better wall color (discussed later) but there were several tricky details that I didn’t fully understand or handle. For this updated post I have reimplemented everything in software and spent a lot of time doing experiments to try and make sure (as much as I can think of ways to verify) that I am calculating everything correctly when generating the images.
The scope of what I have been doing has accidentally spread beyond my original intention (which was to focus solely on exposure) and now also encompasses indirect lighting (aka global illumination) since it was necessary to implement that properly in order to make fair comparisons with photographs.
Instead of using my interactive GPU ray tracer I have created a software path tracer which was used to generate all of the rendered images that I show in this post. The goal of this software path tracer was to be a reference that I could rely on to serve as ground truth. The goal was not to make this reference path tracer fast, and I haven’t really spent the time to implement any performance optimizations besides ones related to probability and reducing variance (i.e. ones that will also be useful in real-time on the GPU). The result of the emphasis on correctness but not performance is that the images in this post take a very long time to generate and because I didn’t want to wait too long they all have some noise.
Exposure Scale
To take the raw luminance values and simulate the exposure of a camera based on a given exposure value I mostly followed the method from the Moving Frostbit to PBR course notes. One difference is that instead of using 0.65 for the “q” value I used \(\frac{\pi}{4}\) (which is about ~0.785), but otherwise the equation for calculating an exposure scale is the same as what the Frostbite paper gives:
\[(\frac{78}{100 \cdot \frac{\pi}{4}}) \cdot 2^{EV_{100}}\]Where EV100 is a user-selectable exposure value (assuming an ISO film speed of 100). The raw luminance arriving at the camera is divided by this value to calculate the exposed luminance.
I write more about this exposure scale in the supplemental section at the end of this post for anyone interested in technical details. The important thing to understand for reading this post is that an intuitive EV100 value can be chosen when generating an image (just like an EV100 value can be chosen when taking a photograph) and this chosen EV100 value is converted into a value for shading that scales the physical light arriving at the camera to simulate how much of that light would be recorded while the camera’s shutter was open.
Light Color
As discussed earlier these exposure tests intentionally don’t include any white balance adjustments. In order to match the color shown in the photographs it is necessary to calculate the color of a 2700 K light source.
The sRGB gamma-encoded 8-bit RGB values of a an idealized 2700 K black-body radiator are [255, 170, 84], the color of the background of this text block. If you compare this with a photograph you can see that it is a reasonably close match:

I write more about how this color is calculated in the supplemental section at the end of this post for anyone interested in technical details. The important thing to understand for reading this post is that the color that my program is using for the light bulbs is what is shown as the background of this paragraph, and that this color should also theoretically match what my camera senses even if it looks different to human eyes.
Programmatic Light Luminance
Even though calculating the color of a 2700 K black body also tells me what the luminance of an idealized light bulb filament would be this value can’t be used for these experimental tests because I don’t know the surface area of the bulb’s filament (and the LED bulb doesn’t even have a filament and its light isn’t generated by incandescence). Instead of using the theoretical black-body luminance when rendering images the luminance for the light sources must be derived from the light output (the luminous flux) that the manufacturers report for the bulbs. This reported flux is 190 lumens for the dimmer incandescent bulb and 800 lumens for the brighter LED bulb.
If a spherical light source emits luminance uniformly in every direction from every point on its surface then that single uniform luminance value can be calculated from the luminous flux as:
\[luminance = \frac{fluxInLumens}{4 \cdot \pi^2 \cdot radiusOfLightSphere^2}\]This means that regardless of the size of the light bulb that I use in code the correct amount of luminous flux will be emitted (and I can just have a magically floating sphere that emits light and I don’t have to worry about e.g. the base of the physical light bulb where no light would be emitted by the physical bulbs).
I write more about how this number is calculated in the supplemental section at the end of this post for anyone interested in technical details. The important thing to understand for reading this post is that the number of lumens reported on the packaging of the physical light bulbs can be converted to a number that represents the amount of light emitted from a single direction from a perfect sphere.
Geometry
I only have two rooms in my house without windows and both of them are bathrooms. One of those bathrooms has a mirror, polished countertop (and cabinet), a sloping ceiling, and a bathtub; all of that makes it less-than-ideal for recreating in software accurately enough for tests like I wanted to do. The other bathroom, however, is much better for that purpose: It is very small, is a nice box shape (all corners are right angles) and the only thing in it is a toilet. The walls and ceiling (and light switches, door, trim and toilet) are all white. The floor is grey tile, but at least quite matte. This is the room that I used for all of the photographs and generated images in this post.
I tried to measure the room accurately but I only had a standard tape measure to work with and just accepted that the measurements that I came up with might be close but would definitely not be perfect. I put my camera on a tripod facing the wall (away from the toilet 🙂 ). I only have one lens for my DSLR camera and it can change its zoom, but I looked up the specs and tried to match the zoom and angle of view and hoped that I measured close to where the origin of the camera should be.
Initially I had just modeled the walls of the room (I don’t have any geometry importing yet in my engine and so it is a bit laborious and annoying to type the geometry data in as code), but after looking at the images that I was generating I decided to add an additional box on the wall to represent the light switch plate. This gives some reference to compare with the photographs and made me more confident that I was at least close to recreating the real scene in my program.
The following image gives an idea of the room configuration:
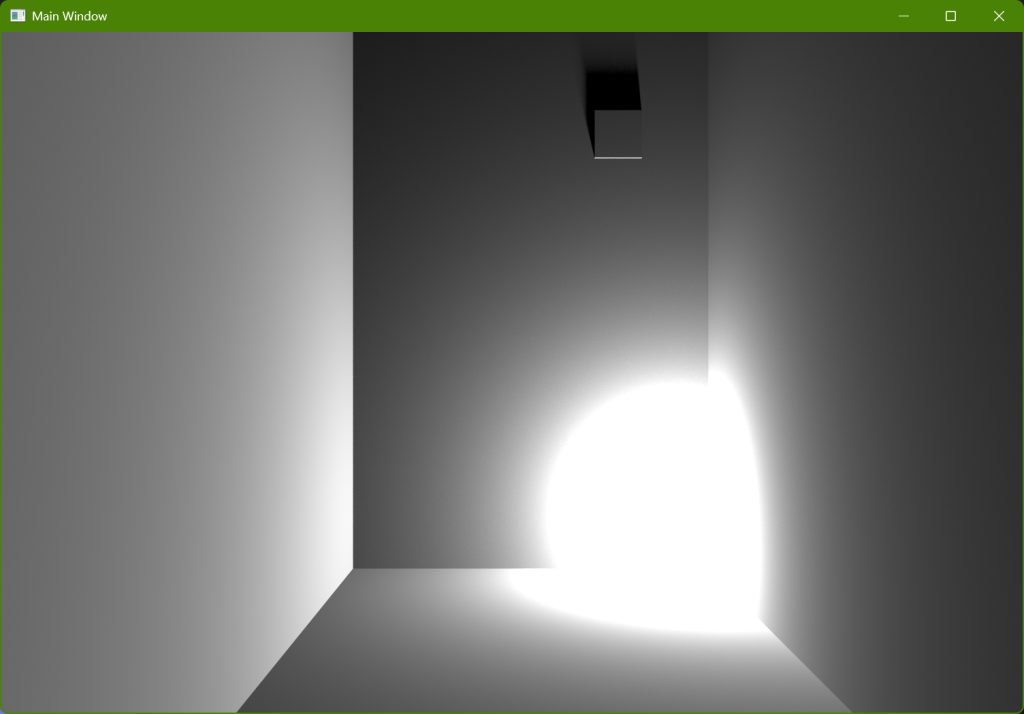
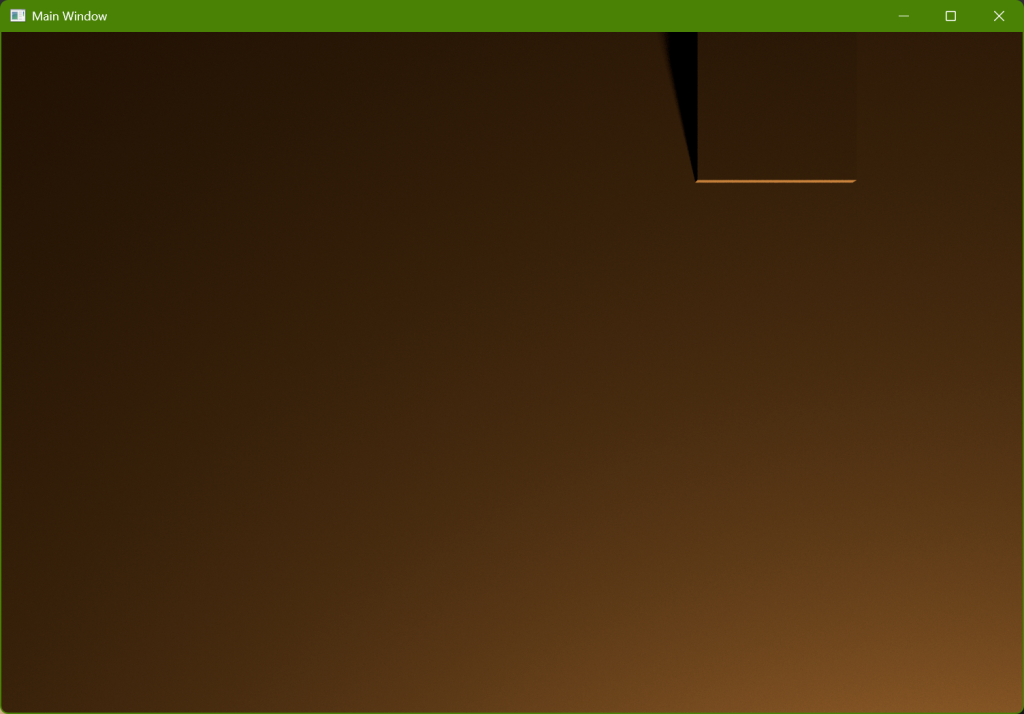
The virtual camera in this particular image is placed further back from where the physical camera was in the actual photographs in order to show more of the room (the later images generated for comparison will have the camera in the correct location to match the photographs); in this view there is a wall close behind the virtual camera and so this image shows what it would look like if you were in the room sitting on a chair placed against the back wall (it is a very small room). The exposure is only a linear scale (no tone mapping) and so the walls and floor near the light bulb are completely overexposed (any values greater than one after the exposure scale is applied are simply clamped to one). Below is the same image but with a different exposure to show where the light bulb is and how big it is:
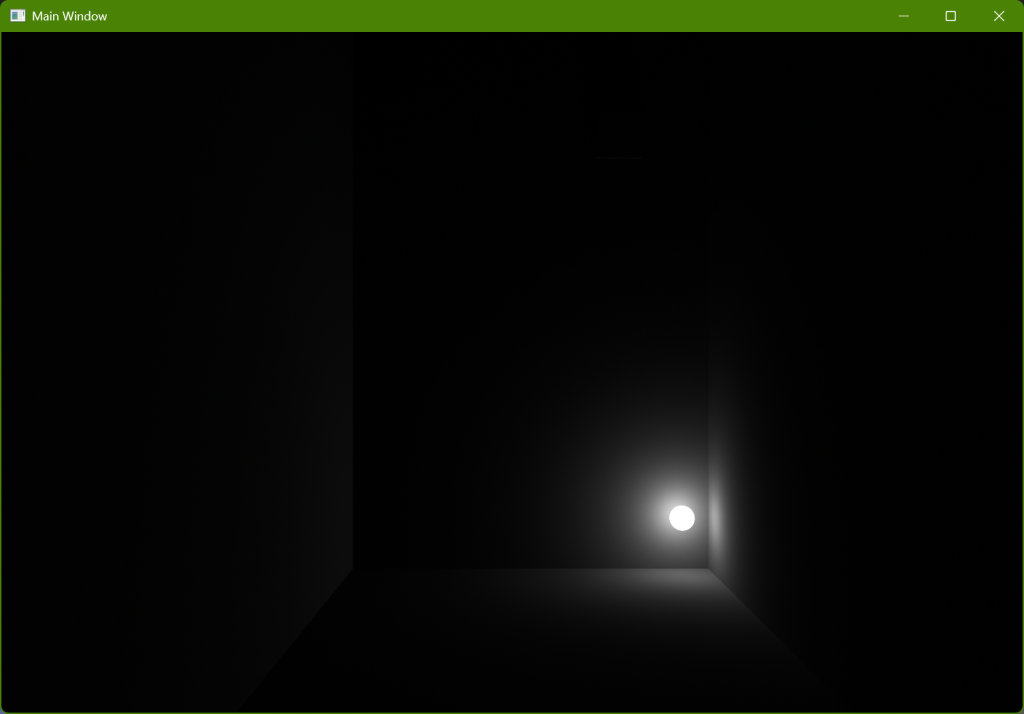
The center of the light sphere is where my measurements estimated the smaller incandescent bulb was. The actual sphere radius, however, is what I measured the LED bulb to be, which is a bit bigger than the incandescent bulb. If my calculations to derive luminance from flux were done correctly then this won’t matter because the lumens will be the same regardless of the radius.
The sphere looks like it’s floating above the floor because the actual physical light bulb was on the little stand that can be seen in earlier photographs:

I didn’t model the stand, but measured where the center of the incandescent bulb was when the stand was on the floor to try and place the virtual sphere so that it was centered at the same location as the center of the incandescent light bulb (which was slightly lower than the center of the LED bulb when it was in the stand).
Results
In my original post I presented the results in roughly the same order that I produced them and tried to document problems and subsequent solutions because I think it’s interesting and valuable to read the troubleshooting process in posts like these. Because so many of my conclusions turned out to be either inaccurate or fully wrong, however, I am presenting things in this updated post in a different order than what I discovered chronologically and no longer try to show the incremental improvements.
One big problem that I ran into, however, is worth mentioning and showing the changes that were required to fix it: In the initial version of this post I was treating all of the surfaces in the room (the walls, ceiling, and floor) as perfectly white because (I thought) it was a nice simplifying assumption. Spoiler alert, this turned out to be a bad idea! When I only rendered direct lighting I was getting results that were what I would have expected but when I started adding indirect lighting I was getting results that I neither expected nor understood.
There is a large amount of additional information about my explorations into indirect lighting in the context of trying to match actual photographs to images that I rendered which I have put in a separate post which can be read here. For this current post the only thing that you need to understand is that using pure white was bad and I had to find better approximations for the color of surfaces in the room.
Approximating Wall Color
I needed to change the wall color to not be perfectly white. I knew what paint had been used for my bathroom walls and so I did an internet search and found this page, which specifies not only a color for the paint but also an “LRV”. I don’t remember whether I had previously encountered the concept of LRV for paints, but it stands for “Light Reflectance Value” and sounded like exactly what I was looking for in order to be able to quantify how much light should be absorbed at each bounce.
The background of this current paragraph is using the sRGB color values [229, 225, 215] reported on that page and it looks pretty close to the color of my walls (especially when compared to sRGB white, look at the color of the following paragraph to compare). The relative luminance of these specified color values is ~75.41%, which is close to the reported 75.12% LRV but not exact. I haven’t found anything scientific discussing exactly what LRV represents or how it was calculated but since it was so close I decided to treat it as an accurate linear value representing diffuse reflectance (i.e. albedo). For the final wall and ceiling color I rescaled the RGB values to instead have a relative luminance of 75.12% (meaning that the background of this paragraph has the same chromaticity that the walls and ceiling have in my generated images but the actual luminance in the images is slightly darker than this background).
Compare the background of this current paragraph, which is sRGB white (i.e. [255, 255, 255]) with the background of the previous paragraph to get an idea of the color of the walls and ceiling in the room.
With that change to room color an image with only direct lighting looks like the following:
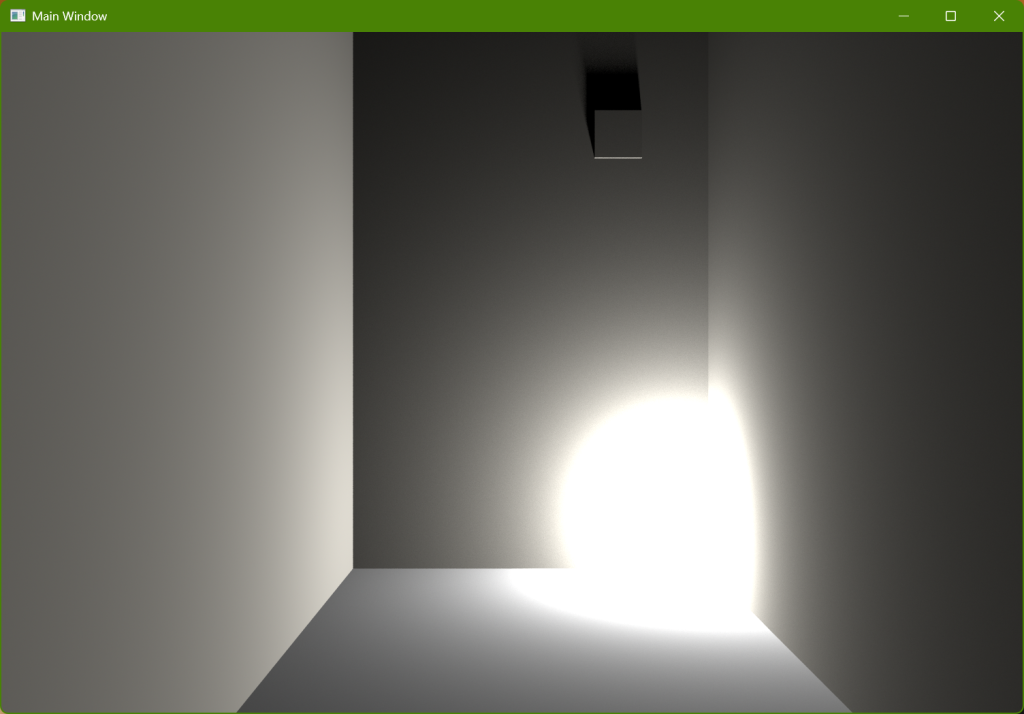
(The difference is subtle in this image because only direct lighting is calculated. One observable consequence of the different color can be seen in the overexposed lighting where there is now some yellow/red hue shift.)
In addition to the wall colors there is also trim, a door, and a toilet that are different colors of white, but I didn’t have them modeled and didn’t want to worry about them. The plastic light switch plate itself is also a different color of white but I didn’t change that either. The floor, however, is substantially different. Below is a photo that gives an idea of what the tile looks like:
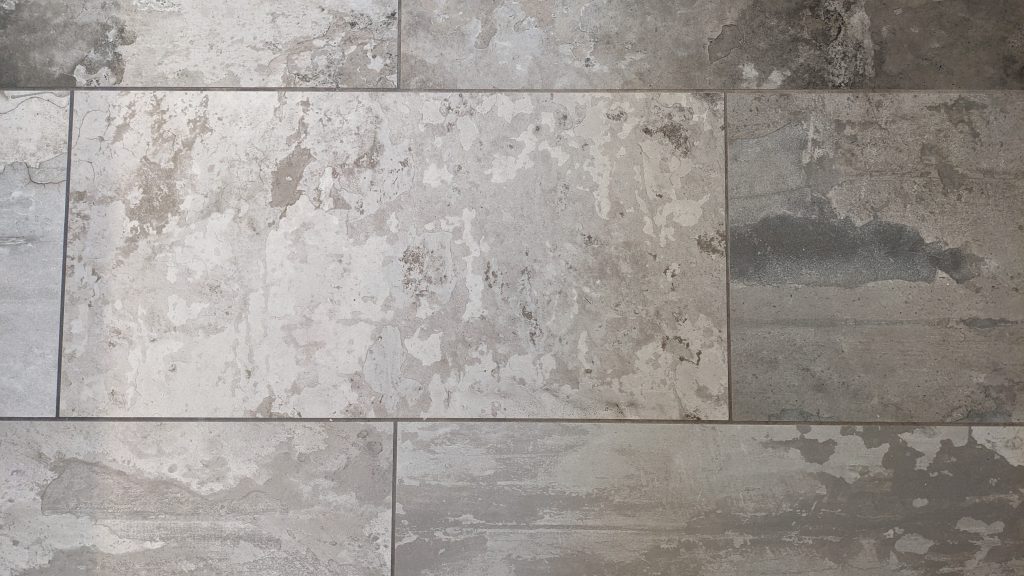
Not only is there variation within each individual tile, but different tiles have different amounts of brightness. I didn’t want to try and recreate this with a texture, and rather than being scientific I just kind of tried different solid colors until it generally felt correct to me subjectively. Below is a rendering of direct light with the final wall and floor colors that I ended up with:
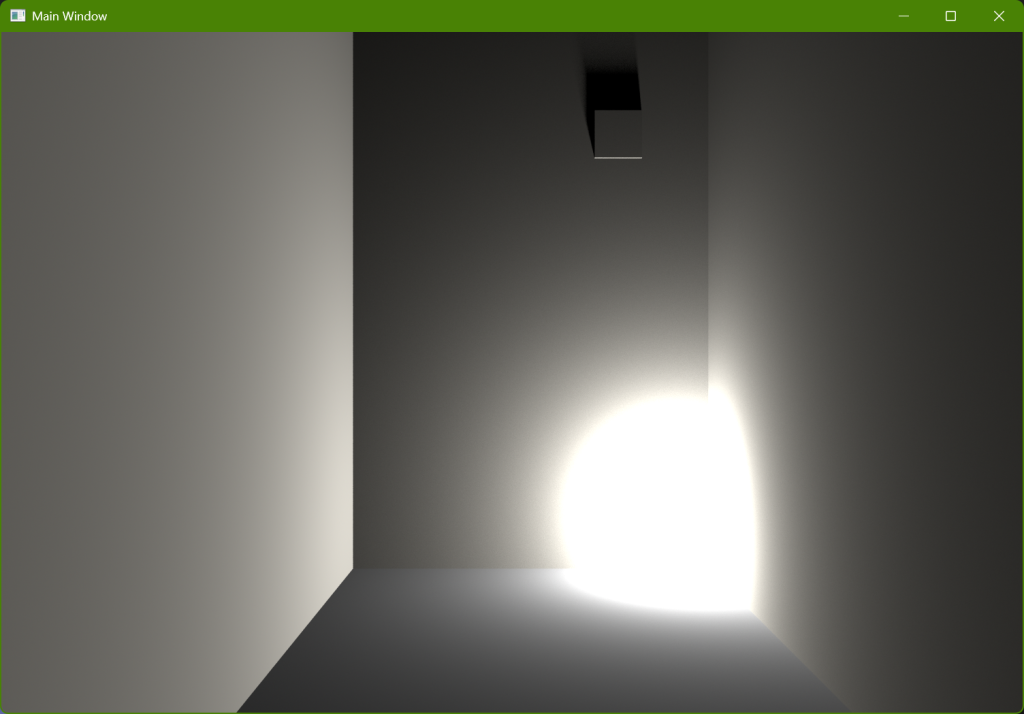
You can see that the floor is now darker than everything else (look at e.g. the overexposed part on the floor compared to the previous image), and it is neutral (as opposed to everything else which is slightly warmer because of the RGB colors of the paint; to be honest I think the floor color is probably not a warm enough grey but I kept it to try and prevent too much subjectivity from being introduced into the experiment). To compare here is the original image again where everything is perfectly white, which makes the differences easier to spot:

Light Color
The generated images that I have shown so far have a white light bulb (where “white” in this context is the white point of the sRGB primaries, i.e. D65), but recall the earlier discussion about the color of a 2700 K incandescent light and how it should be the background color of this paragraph. Making that change but still only showing direct lighting looks like the following:
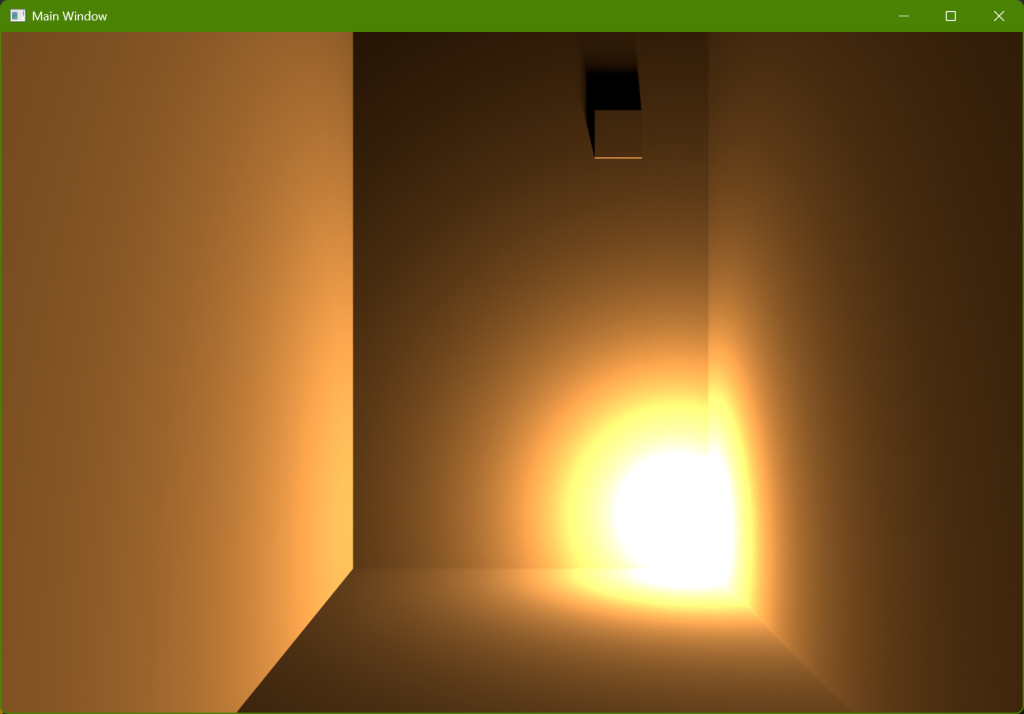
The orange color in this image is representative of what we will be looking at in the rest of this post. To repeat, the color that my eyes perceived when I was actually in the room with the light bulbs was somewhere in between this image and the neutral image immediately preceding this one, but was closer to the white walls and lighting in the earlier image than the very obvious orange in this most recent image. Remember that the orange (i.e. the lack of white balance) is used in order to be able to more accurately compare the generated images and the photographs.
I should also emphasize that the only parts of the generated images that should be evaluated in this post are where the color is not overexposed! No tone mapping is being applied and instead I am just naively clamping any color values greater than one. Specifically, the changes in hue that can be seen in the lighting on the walls immediately surrounding the light bulb shouldn’t be understood as an attempt to model anything good or correct, perceptual or otherwise, and should instead be ignored.
For comparison below is the same image but with a different exposure so that the light bulb itself is visible:
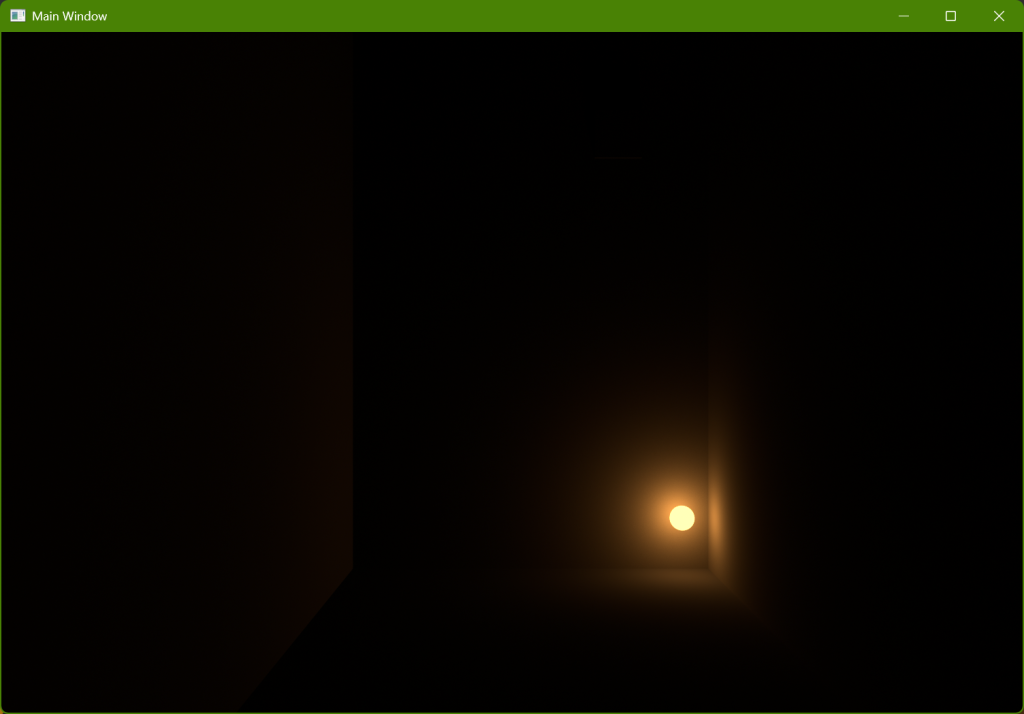
In a properly tone-mapped image that sphere representing the bulb would generally be visible, and the big white/orange/red area that surrounds the light bulb in the brighter exposures doesn’t represent anything except poorly-handled overexposure. Luckily, the placement of the camera in the actual test images (i.e. the images that match the real photographs) don’t show the light bulb and so the extreme overexposure is not as much of a problem.
With the wall, floor, and light colors set up everything is in place to evaluate exposure and to compare whether the images that I generated programmatically match the photographs from my camera!
Comparisons
Rendered Exposure with Direct Lighting
Below is a comparison of rendered images with different light output and different exposure settings. It is one of the same settings comparisons that we saw earlier with real photographs.
190 lumens EV100 4:
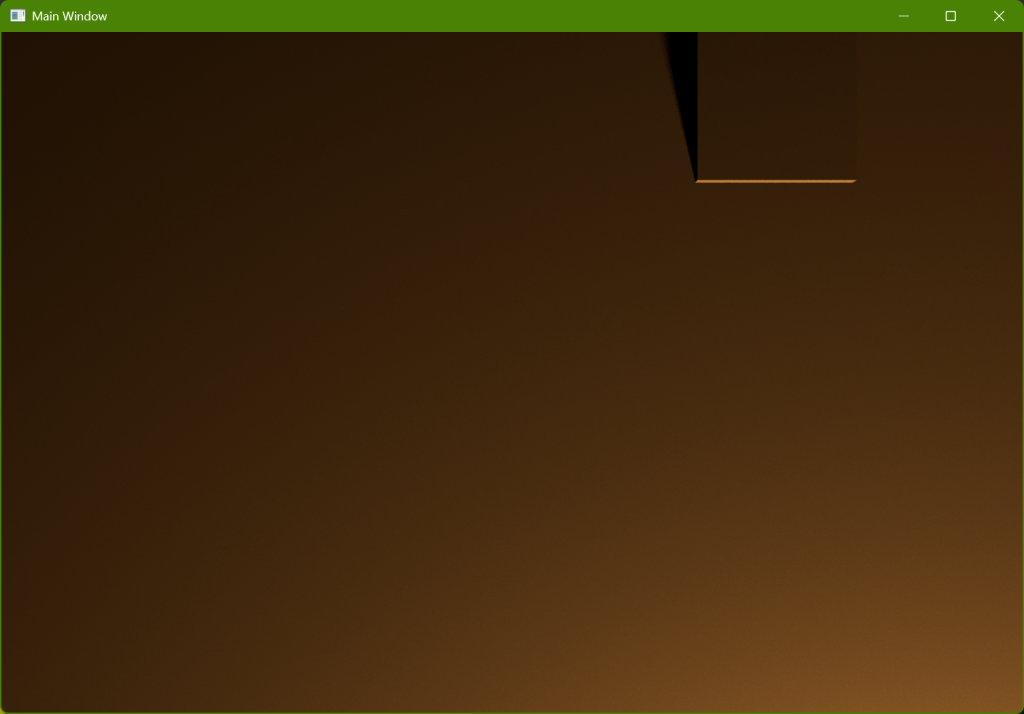
800 lumens EV100 6:
The results are good and expected: The two images are almost identical. The image using 800 lumens is slightly brighter, but that is what we should expect because 190 lumens isn’t quite 200 and so it is slightly less than 1/4 of the brighter light source.
Even though this result is encouraging it isn’t that impressive: All that it really shows is that I am (probably) correctly making the scale between different EVs a factor of 2. In addition to the relative doubling or halving, however, there is an additional constant scale factor involved and there is no way to tell from looking at just these images in isolation whether that constant is correct. In order to try and evaluate the absolute exposure (rather than just the relative exposure) we need to compare a generated image with a real photograph.
Anticipatory drumroll…
Rendered 800 lumens EV100 6:

Photographed 800 lumens EV100 6:

Well… these two images don’t look similar at all! The good news is that my virtual scene set up looks pretty good (the camera seems to be in generally the right place because the light switch plate looks pretty similar in both images). The bad news is that there is an extremely noticeable difference in brightness between the two images, which is what the exposure value is supposed to control.
I have already spoiled the big problem: The rendered image is missing indirect lighting. The darker the walls (and floor and ceiling) and the bigger the room the less of an effect indirect lighting would have (because more light would be absorbed at each bounce before reaching the camera), but since the walls and ceiling in this room are white (not perfectly-reflective white, but still “white”) and the room itself is very small the indirect lighting makes a substantial difference that is missing in the generated image.
Rendered Exposure with Indirect Lighting
Using my software path tracer I can generate an image that includes indirect lighting in addition to the direct lighting, and we can compare that generated image with a real photograph.
800 Lumens
Rendered 800 lumens EV100 6:

Photographed 800 lumens EV100 6:

Hurray! These two images look very similar to me (I wouldn’t have correctly predicted how much brightness indirect bounced lighting adds to my little room). With the exception of the color of the grey tile floor which I just tried to subjectively guess everything else in the rendered image was made trying to use quantifiable values and so it really is exciting for me to see how closely the two images match each other.
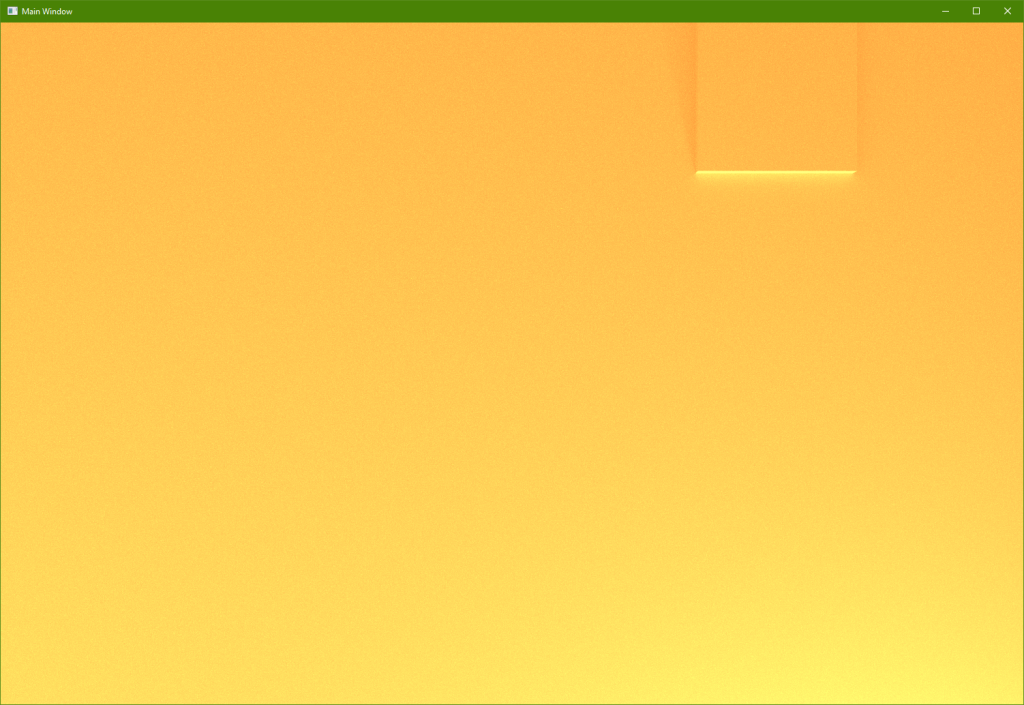
The initial goal of this project was to implement exposure controls that matched the existing photographic concept of EV (exposure values). The following image comparisons show different exposures to see if specifying an EV for a generated image matches the same EV used in a real photograph.
Rendered/Photographed 800 lumens EV100 5:

Rendered/Photographed 800 lumens EV100 4:
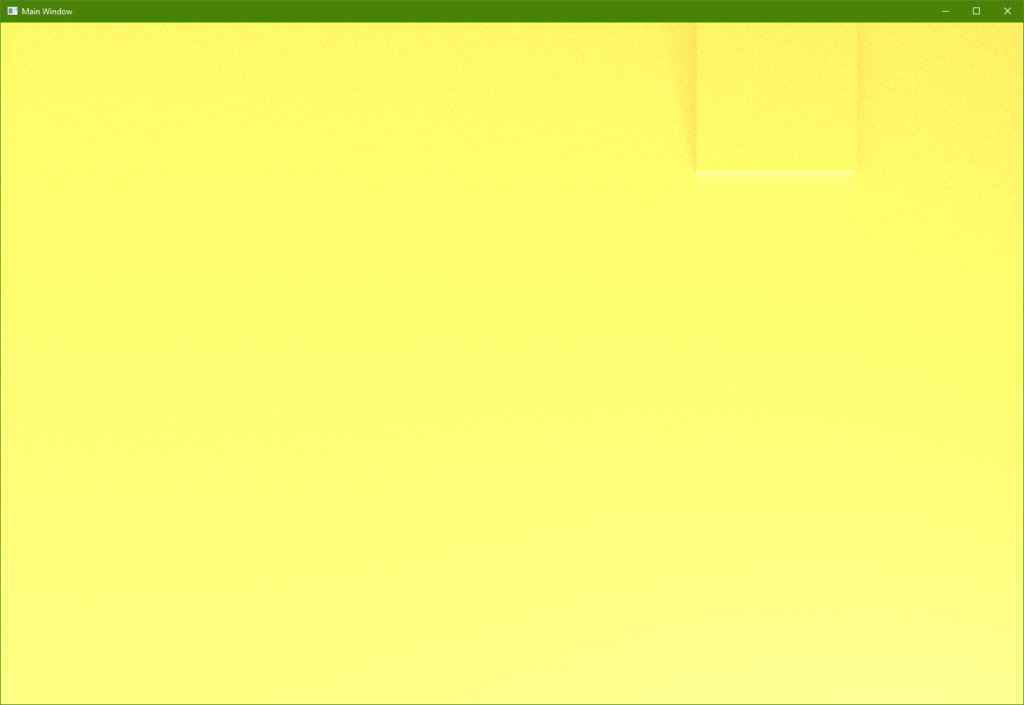

The images with increased exposure don’t match as closely as EV100 6 did, but I’m not as concerned with comparisons of overexposure: The camera is doing some kind of HDR tone mapping and my rendering isn’t and so we probably shouldn’t expect the visuals to match.
More important is how higher EV levels (i.e. less exposure) look, and those comparisons are shown below.
Rendered/Photographed 800 lumens EV100 7:
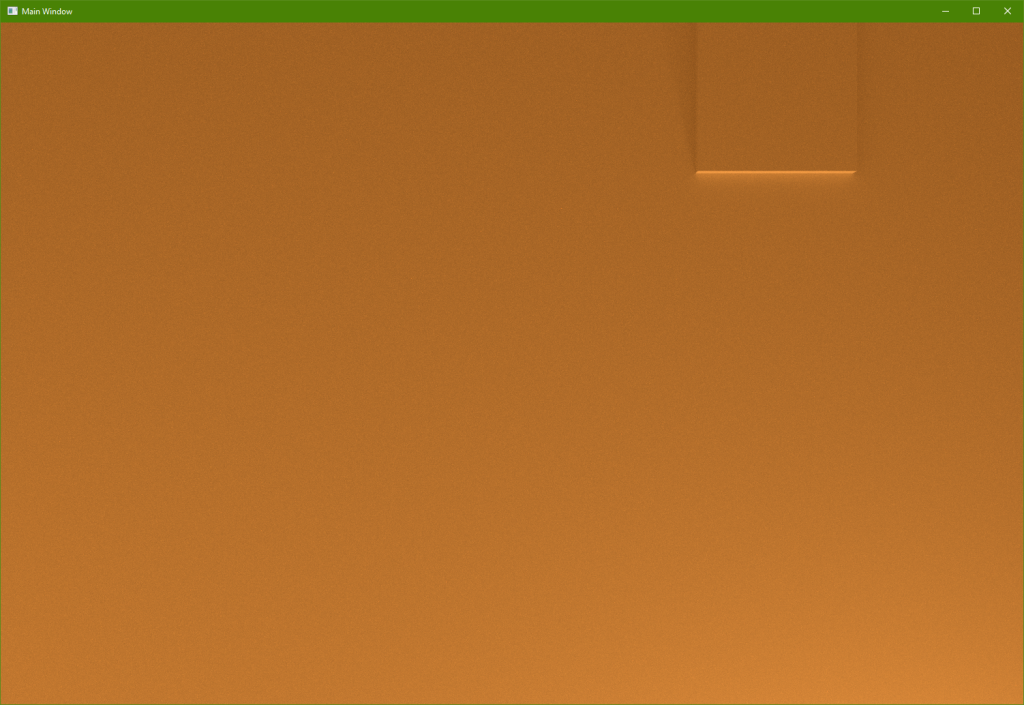

Rendered/Photographed 800 lumens EV100 8:
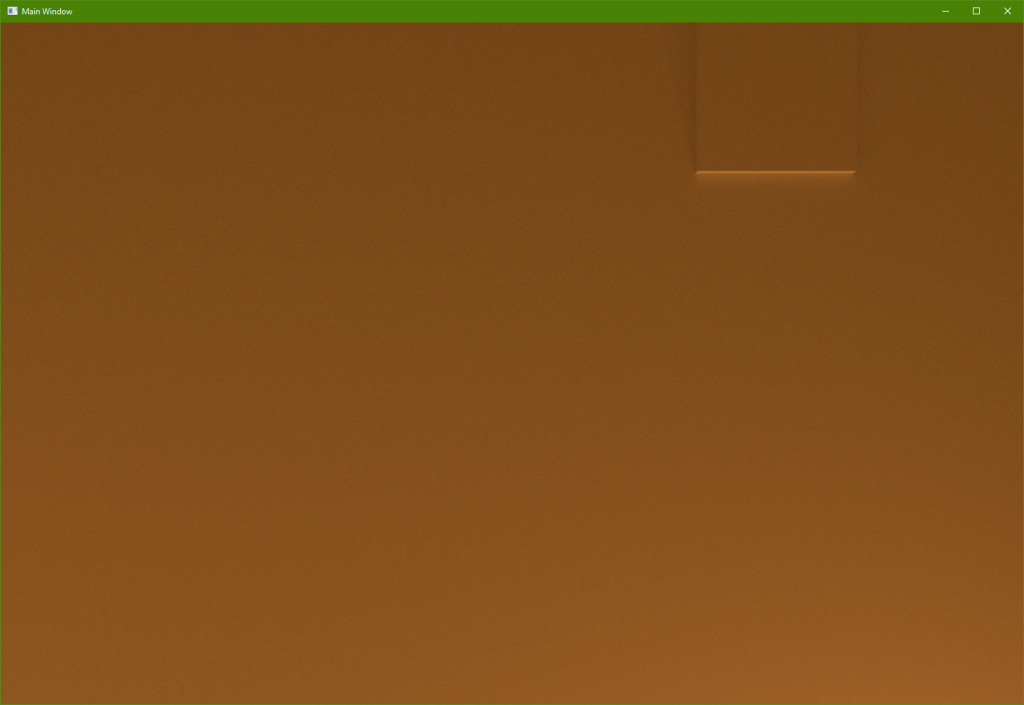

Rendered/Photographed 800 lumens EV100 9:


Rendered/Photographed 800 lumens EV100 10:


Rendered/Photographed 800 lumens EV100 11:


Rendered/Photographed 800 lumens EV100 12:


I would rate these results as ok but not great; the comparisons are definitely not as close as I would have liked. EV100 7 still looks really similar to me (like EV100 6 that I showed initially), but higher EVs start to show pretty clear divergence between the generated images and the photographs. It does seem like the camera is doing some kind of color modification when the image is dark (apparently to increase the color saturation?), but even ignoring that change it looks to me like the camera photographs are brighter than the rendered images. This, unfortunately, means that they don’t really look the same. The difference isn’t terrible, but unlike the results for Ev100 6 and EV100 7 I don’t think anyone would look at the darker images and say “oh, yeah, those look the same!”, which is disappointing.
190 Lumens
For the sake of being complete a comparison is shown below of a rendered image and a photographed image with a 190 lumens light source at EV100 4:
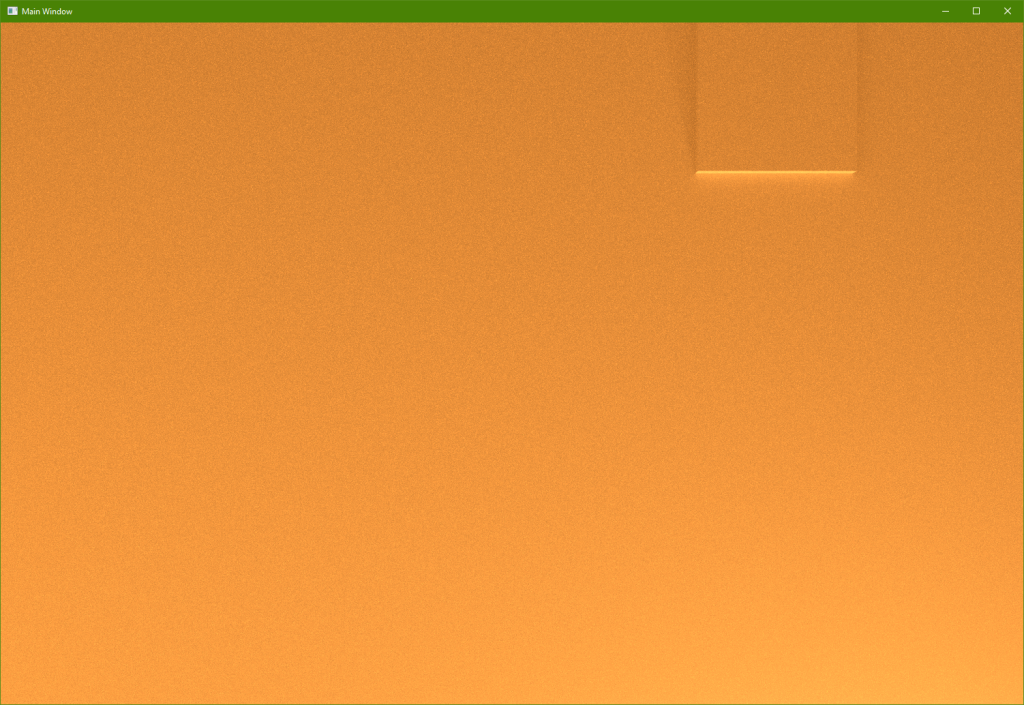

We would expect these to look the same based on the previous comparisons, but it’s still nice to see confirmation and to end on a positive note.
Conclusion
I think that the comparisons between generated images and photographs are close enough to call this experiment a success, especially since the EV values that are close to how one would actually expose the scene (6, 7, and 8) are very similar between renderings and photographs. Let me repeat the sequence of EV100 6, 7, and 8 with photographs and renderings interleaved:


It’s disappointing that the darker exposures aren’t as close as when using EVs 6-8, but I think they are still close enough that I can probably consider my code to have a good foundation for controlling exposure. It’s certainly possible that I might still find a flaw or potential improvement in my code that would make the rendered images more similar to the photos (this current post is, after all, a revision of a previous post where I had initially asserted that I was happy with the results only to later change my mind), but as I am writing this I am satisfied with the results.
The remaining high-level tasks to deal with HDR values are to implement some kind of tone-mapping for those values that are too bright (rather than just clamping individual channels like I do in this post) and bloom (to help indicate to the observer how bright those values that are limited by the low dynamic range really are). Those HDR tasks and then some kind of white balancing would be required to actually generate images that appeared the same perceptually to me as what my eyes told my brain that I was seeing when I was in the room taking the photographs.
This was a fun and fulfilling project despite many frustrations along the way. I have worked with exposure in graphics many times but until now I had never implemented it myself. It has been interesting to finally be able to make a personal implementation working from first principles rather than using someone else’s existing version; working through problems one’s self always helps to gain a better understanding than just reading others’ papers and blog posts does. I especially have wanted to do experiments and comparisons with actual photographs for a long time and it was nice to finally get around to doing it. (This project also reinforced my understanding of how exposure works with real cameras, which was a nice bonus!)
If you found this post interesting I might recommend also reading this supplemental post with more images of indirect lighting whose content was originally part of this one. That post uses the same room and light bulb setup as this post and shows experiments that I did to try and gain a more intuitive understanding for how indirect lighting behaves.
Supplemental Material
Below I have included some additional technical details about these experiments. This information is probably only of interest if you happen to want to try implementing something similar yourself.
Exposure Scale
This section gives more technical details about how I apply different exposure values to the luminance values that are calculated as part of rendering. As previously mentioned I follow the method for adjusting exposure from the Moving Frostbite to PBR course notes, specifically the convertEV100ToExposure() function in section 5.1.2.
The Wikipedia page for exposure gives nice definitions with explanations, but the important thing is that exposure (\(H\) in the Wikpedia article) is \(E \cdot t\), where \(E\) is either irradiance or illuminance and \(t\) is time; this just says mathematically what the earlier discussion in this post tried to describe more intuitively, that exposure is directly related to time and describes how long the sensor is exposed to light while recording an image.
When a program is generated automatically, however, the time doesn’t matter (at least not with the standard kind of rendering that I am doing with a simplified camera model and no motion blur). In order to calculate exposure the goal is to end up with the same \(H_v\) exposure effect that a physical camera would have given some illuminance and exposure time and to match that to the established EV system.
The Wikipedia page for film speed gives alternate equations to calculate \(H\), which is where that Frostbite function comes from (as it states in the comments). The equation for \(H\) can be used with the equation for saturation-based speed (and a “typical” value for \(q\)) to end up with the final simple formula that the Frostbite function has, which is something like:
const float ev = ?;	// The chosen EV100 to match my photographs
const float maxLuminanceThatWontSaturate = 1.2f * pow(2.0f, ev);
const float luminanceScaleForExposure =
	1.0f / maxLuminanceThatWontSaturate;
What this is doing is calculating some luminance value that is considered the maximum value possible without saturating the camera sensor, and then calculating a multiplicative value that scales everything equal to or lower than that luminance to [0,1] (and everything brighter than that luminance will be greater than 1).
Let’s examine the \(q\) term and where the typical value that Frostbite uses comes from. The Wikipedia page shows how the final typical 0.65 value is calculated but there are several values used in the derivation that are based on aspects of real physical camera things that don’t seem relevant for the idealized rendering that I am doing. \(q\) is defined as:
\[q = \frac{\pi}{4} \cdot lensTransmittance \cdot vignetteFactor \cdot cos^4(lensAxisAngle)\]Transmittance is how much light makes it through the lens. In the idealized virtual camera that I am using there is no lens and no light is lost which means that the transmittance term is just 1.
The vignetting factor is how much the image light changes as the angle from the lens axis increases. I don’t want any vignetting in my image, and so the vignette term is just 1.
What I am calling the lens axis angle is the angle between the perpendicular line from at the center of the lens and any other part of the lens (the same angle that vignetting would use). My virtual camera is an idealized pinhole camera and as with vignetting I don’t want any change in exposure that is dependent on the distance from the center of the image. That means that the lens axis angle is always 0° and the cosine of the angle is always 1.
Thus, most of the terms when calculating \(q\) simplify to 1:
\[q = \frac{\pi}{4} \cdot lensTransmittance \cdot vignetteFactor \cdot cos^4(lensAxisAngle)\] \[q = \frac{\pi}{4} \cdot 1 \cdot 1 \cdot 1^4\] \[q = \frac{\pi}{4}\]And so I use \(\pi/4\), about ~0.785, for \(q\) instead of 0.65.
To calculate exposure, then, the maximum luminance that won’t clip can be calculated as:
\[maxNoClipLuminance = \frac{factorForGreyWithHeadroom}{isoSpeed \cdot q} \cdot 2^{EV_{100}}\]The \(EV_{100}\) in that formula is the user-selectable EV level (e.g. EV100 6) that we have seen in the photographs and generated images in this post.
The Wikipedia page for film speed defines a constant factor and its purpose: “The factor 78 is chosen such that exposure settings based on a standard light meter and an 18-percent reflective surface will result in an image with a grey level of 18%/√2 = 12.7% of saturation. The factor √2 indicates that there is half a stop of headroom to deal with specular reflections that would appear brighter than a 100% reflecting diffuse white surface.” I use the 78 without change.
I have mentioned ISO film speed a few times in this post, mostly in passing. For the purposes of specifying EVs for exposure I always want to assume a standardized ISO speed of 100 (which is what I mean when I write the subscript in something like EV100 6).
The formula for calculating the maximum luminance value that won’t clip for a given exposure value thus simplifies to:
\[maxNoClipLuminance = \frac{factorForGreyWithHeadroom}{isoSpeed \cdot q} \cdot 2^{EV_{100}}\] \[maxNoClipLuminance = \frac{78}{100 \cdot \frac{\pi}{4}} \cdot 2^{EV_{100}}\] \[maxNoClipLuminance = \frac{3.12}{\pi} \cdot 2^{EV_{100}}\]This calculated \(maxNoClipLuminance\) value is used by Frostbite to scale the raw luminance values such that a value that matches the magic value is scaled to one and any values with a higher luminance end up being greater than one. In other words:
const auto exposedLuminanceValue =
	rawLuminanceValue / maxNoClipLuminanceValue;
Using the calculation as a simple linear scale factor is nice because it’s easy to understand and computationally cheap but intuitively it somehow felt to me like it was too simple because it doesn’t take tone mapping into account and based on the Wikipedia quote regarding the target of \((18\% / \sqrt{2})\) I would have thought that the exposure would somehow have to be done in tandem with tone mapping. In the initial version of this post I even came up with an alternate way of scaling exposure that was my own invention and that seemed to produce better results. After I fixed all of my other bugs, however, the Frostbite method ended up producing images that are very close to the photographs from my camera (as seen in this post). Perhaps when I add tone mapping I will have to reevaluate the exposure scale and modify it, but for now it seems to work quite well.
Light Color
This section gives a few more technical details about how to calculate the incandescent color of a 2700 K black-body. This information is given with very little explanation and is intended for readers who already understand the concepts but are interested in checking my work or implementing it themselves.
The amount of radiance for each wavelength can be calculated using the formula on this Wikipedia page using wavelength: \(\frac{2hc^2}{\lambda^5 (e^{\frac{hc}{\lambda k_B T}} – 1)}\)
Human color-matching functions for each wavelength can be found here, which are necessary in order to convert spectral radiance values to luminance values. (If you’re not familiar with radiance vs. luminance then a simplified way to think of it intuitively is that I needed to only work with the light that is visible to humans and ignore infrared and ultraviolet light).
I used the 2006 proposed functions (rather than the classic 1931 functions), with a 2 degree observer in 1 nm increments. Weighting the spectral radiance of each wavelength gives an XYZ color for a specific spectral wavelength and integrating over all wavelengths gives the XYZ color that a “standard observer” would see when looking at a 2700 K black body. That XYZ color can be converted to an sRGB color:
According to my calculations the resulting sRGB gamma-encoded 8-bit RGB values for 2700 K are [255, 170, 84], the color of the background of this text block.
Digression: Luminance of an Incandescent Light Bulb?
When I calculate the color using the above technique I find that a 2700 K incandescent black-body’s luminance is ~12,486,408 nits.
This is a different value from other sources that I can find, significantly so in some cases. My first edition of Physically Based Rendering says 120,000 nits for a 60-watt light bulb (although that section appears to have been removed from the latest online edition), this page has the same 120,000 number but for a frosted 60 W bulb (which would understandably be a lower number), and this page says 107 nits for the tungsten filament of an incandescent lamp, which is at least pretty close to my result compared to the others.
I am putting my result here in its own section in case anyone finds this through Google searching and has any corrections or comments about the actual emitted luminance of an incandescent light bulb. It seems to me that the watts of a bulb shouldn’t matter (for an incandescent bulb with the same color temperature the luminance should be the same regardless of watts (shouldn’t it?), and the total lumen output is determined by the surface area of the filament, which is visibly different in size between otherwise-identical incandescent bulbs rated for different watts), but I definitely could be making calculation errors somewhere. In a previous job when I had access to a spectroradiometer I did a lot of experimental tests to try and verify if my math was correct but that ended up being more difficult than I would have anticipated and so I wasn’t able to definitely verify the number to my satisfaction. To the best of my knowledge the luminance of a 2700 K black body is ~12,486,408 nits, even though I haven’t been able to find any independent corroboration of that. The filament of an incandescent light bulb gets extremely hot and also extremely bright!
Programmatic Light Luminance and Intensity
This section gives a few more technical details about how to calculate the luminance emitted by a spherical light source (and the luminous intensity emitted by an idealized point light source). This information is given with little explanation and is intended for readers who already understand the concepts but are interested in checking my work or implementing it themselves.
For a light bulb that is represented as a sphere first the luminous flux must be used to derive luminous emittance (also called luminous exitance). The flux is the total amount of energy emitted from the bulb per second, and the emittance/exitance is how much of that energy is emitted per surface area. In a real incandescent light bulb we would have to worry about the filament but if we instead model the light as an idealized sphere we can say that the amount of emitted light is uniform everywhere on the sphere (i.e. any single point on the sphere emits the same amount of light as any other point on the sphere), and so the flux can be divided by the surface area of a sphere:
\[emittance = flux / areaOfSphere\] \[emittance = flux / (4 \cdot \pi \cdot radiusOfSphere^2)\](Dividing by the surface area like this means that the flux density will be smaller for a point on bigger light bulb and greater for a point on a smaller light bulb but the total flux that is emitted will be the same. This is good because it means that even if my measurement of the radius of a physical light bulb isn’t exact the total flux will still be correct and that is the important value to represent accurately because it is the one that is reported by the manufacturer.)
Once luminous emittance is calculated it can be used to derive the actual luminance. The emittance is the density of the emitted energy at a single point, and the luminance is the angular density of that energy at a single point. Said a different way, now that we know how much energy is emitted from a single point we need to find out how much of that energy is emitted in a single direction from that single point. In a real incandescent light bulb we would have to worry about the emitting properties of the filament (and also the geometry of the filament since it is wound around and some parts occlude other parts), but when using an idealized sphere we can assume that the the same amount of light is emitted in every direction from every point. The relevant directions that light is emitted from a point on the surface of the sphere are in a hemisphere around that point on the surface (even though the surface itself is a sphere we are only concerned about a single point on that spherical surface, and the directions that light is emitted at a single point on that spherical surface are only in a hemisphere (there is no light emitted from the surface towards the center of the sphere, for example)). This means that to convert from luminous emittance to luminance is to divide by \(\pi\) (note that although I’m stating this as a simple fact that doesn’t mean that it’s an obvious fact unless you’re used to integrating over hemispherical directions; if you want more explanation this might be a good place to start):
\[luminance = emittance / \pi\] \[luminance = flux / (4 \cdot \pi^2 \cdot radius^2)\]In my original hardware ray tracing program I used a point light for simplicity but ironically this turned out to be harder for me to reason about than a spherical area light when figuring out how to calculate probabilities. A point light has no area and so neither luminous emittance nor emitted luminance can be calculated for it. Instead we can calculate luminous intensity, which is how much flux is emitted in each direction (i.e. it is kind of like luminance without the area). If we assume that the point light emits the same amount of light in all directions (just like the sphere) then:
\[intensity = flux / solidAngleOfAllSphericalDirections\] \[intensity = flux / (4 \cdot \pi)\]When used to calculate the illuminance of a point on a surface (like my room’s wall) the luminous intensity must be modified by the distance from the point light squared.